isolation mission

On 23 and 24 October I took part in an isolation mission inside a spaceship simulation. This mission is part of the social design project Seeker by Belgian artist Angelo Vermeulen. A group of architecture master students from the TU/e worked on an exploration of living in space and build an experimental spaceship. The aim is to research how ecology, sociology and technology can merge and provide integrated living environments for the future. I’ve build a relaxation device for the astronauts.
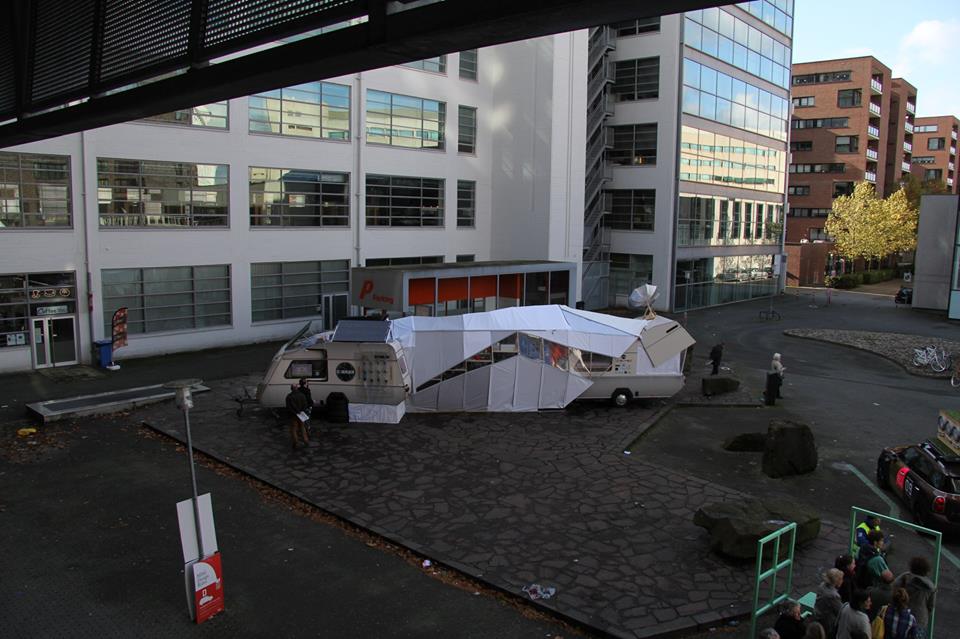
Seeker picture by Rene Pare

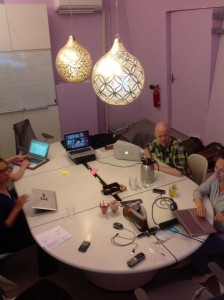
Part of this project is an isolation mission where a crew enters the spaceship and is locked in for two days. During that time they are completely self-sufficient and no input from outside is allowed. I was one of the four crew members. My main motivation for joining was to learn more about self-sufficient living and to test my relaxation device.

Being locked in with three other people I hardly knew seemed quite daunting to me as I’m kind of a hermit and have experience with living alone for a month. The space was quite small. The public could look inside and there was no privacy what soever.

The first thing that became clear when we entered was that there was so much to do. This was going to be our home for the next few days so we had to make it tidy and cosy. But we started out with an introduction round, as we didn’t know each other. Amazingly enough that turned into a good conversation. It appeared we all were interested in spirituality and that became the theme for the mission. After the talk I seemed like we’d known each other for a long time. Angelo said that his team at the HI SEAS mission also immediately had a click. But maybe it is also the setting, being dependent on each other that creates a bond? Or maybe an experiment like this attacks like-minded people?

We were told to bring books and magazines but it turned out we had absolutely no time for reading. From the first moment it was if I’d entered a pressure cooker. All my senses were sharp and my brain was going full speed. Living in such an environment is difficult. Everything is cramped and living has a camping feel to it. Tasks take an awful lot of time to complete (cooking took 2 to 2.5 hours).

The whole experience took me back to my childhood. I used to like to make things but we didn’t have so much proper tools at home. So I just made do with what was there. It makes one very inventive. I suppose that is where my artistic roots lay. I really loved the feeling of being so challenged. And I love the solutions we all came up with.

The collaborative part was really inspiring. I loved the merging of the relaxation device with the workout / energy generation. The students came up with making the water usage visible using transparent water bottles. I extended that with making the waste bins transparent. It is such an easy way to become aware of your behaviour.

The meals were great, we even ate an original HI SEAS recipe. We also got some lovely bread from the bakery next door. And Angelo’s nano whine was a real mystery. (We had to put the wine in the microwave to get different tastes, it really worked!) I suppose I loved our conversations the best. From that we decided I’d give a little introduction to Zen meditation. So we enjoyed a couple of minutes silence between us. With people looking through the window, that was very special.

For me personally it was good to see that I have qualities as a hermit as well being a team player. Working, thinking and talking together really made this a rich experience. But I do see now why in monasteries they have a strict timetable. That makes it a lot easier to get things done. For me that would be the next step to explore and experiment with.
installation

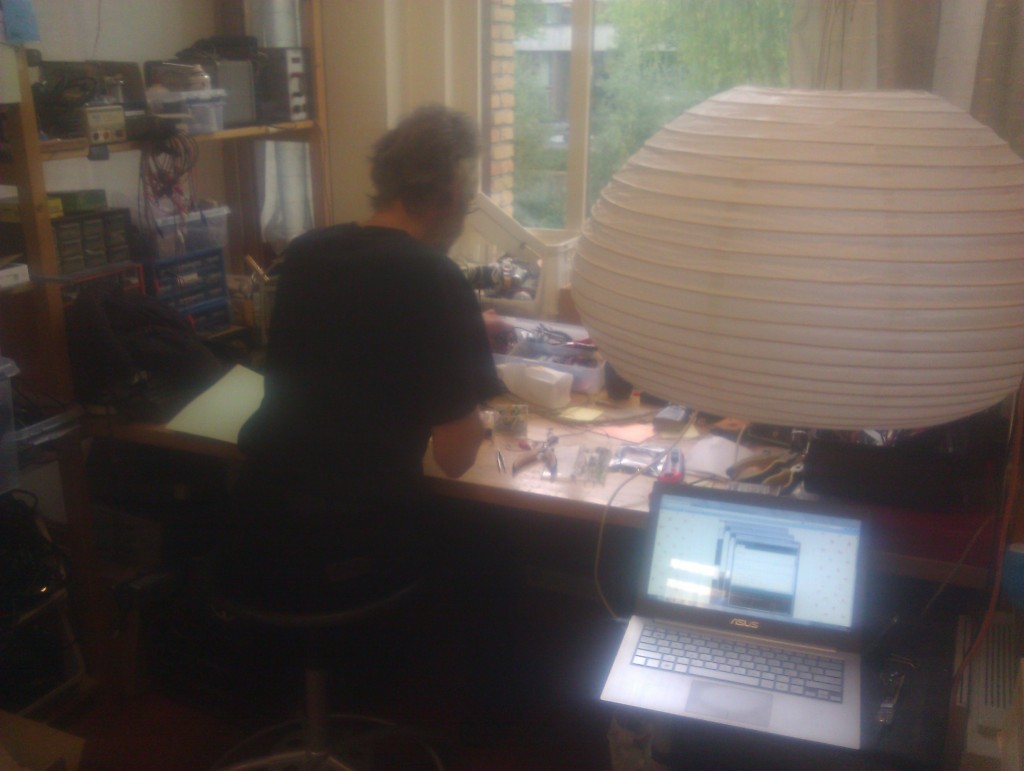
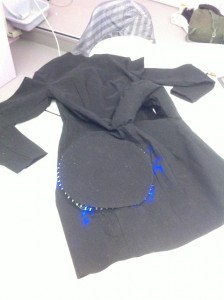
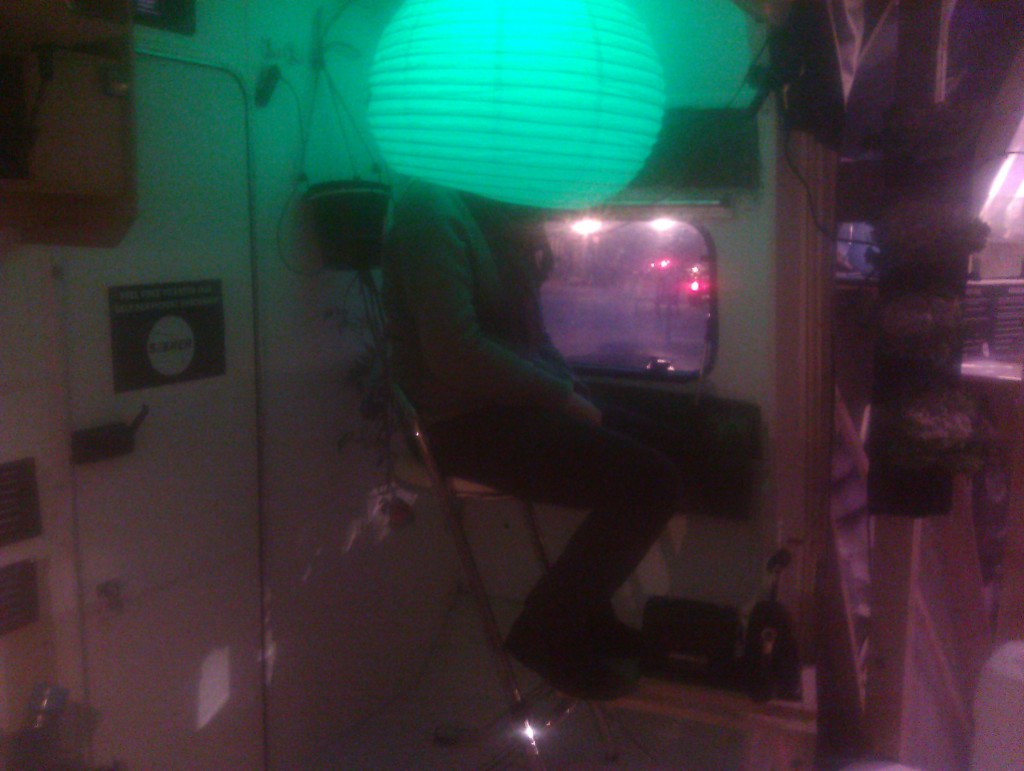
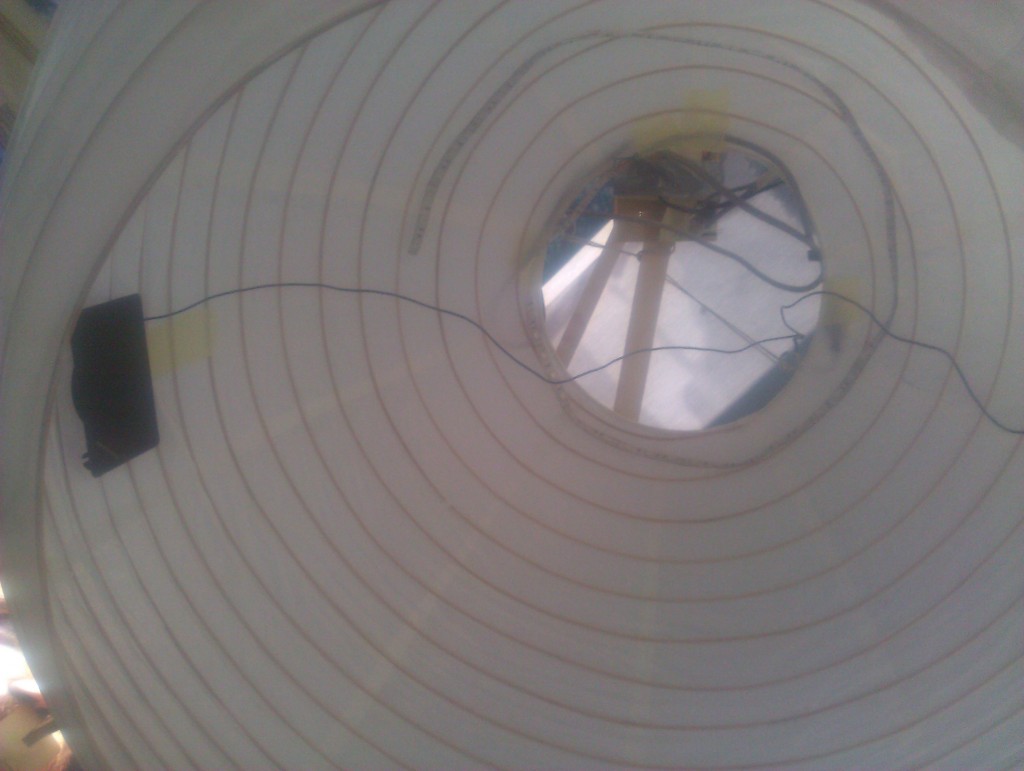
Just before the end of our isolation mission we were able to finish the @cocoon installation. Living inside a spaceship is very hectic and inefficient so we didn’t get round to finishing until the very last minute. Due to that I only have one poor picture:

As you can see we integrated the relaxation with working out (and human energy harvesting). So it has become a mind-body piece. But you can’t actually do the two things at the same time, as the paddler makes a lot of noise which overwhelms the subtle nature sounds.

Despite it’s basic nature it still is effective. Once you’re in the cocoon you do enter a different space. The reflected green colour is subtle enough. The nature sounds could have been a little louder but they’re very lifelike and immediately get you into a good mood.

In the morning I installed the piece in a different place. The rest of the crew didn’t find that suitable so we were going to look for a better place elsewhere. Somehow one of the speakers didn’t work any more so we had to fix that also.

I was really keen to get an exercise area. So while considering a new location we got the idea to combine the two and use the barstool to sit on for either relaxation or workout. Angelo and I are very happy with our collaborative work. That’s the power of working together. Together we also figured out what was wrong with the speaker. The plugs didn’t fit exactly (I had loosened them at one point to check something) and the contact was poor. With bits and pieces lying around I managed to get a stable connection. We decided to screw the sphere straight onto the ceiling with gives it a sculptural effect.

I got a message that on Saturday the installation short circuited so it had to be removed. Again proof that extensive testing is paramount.

hard and software done

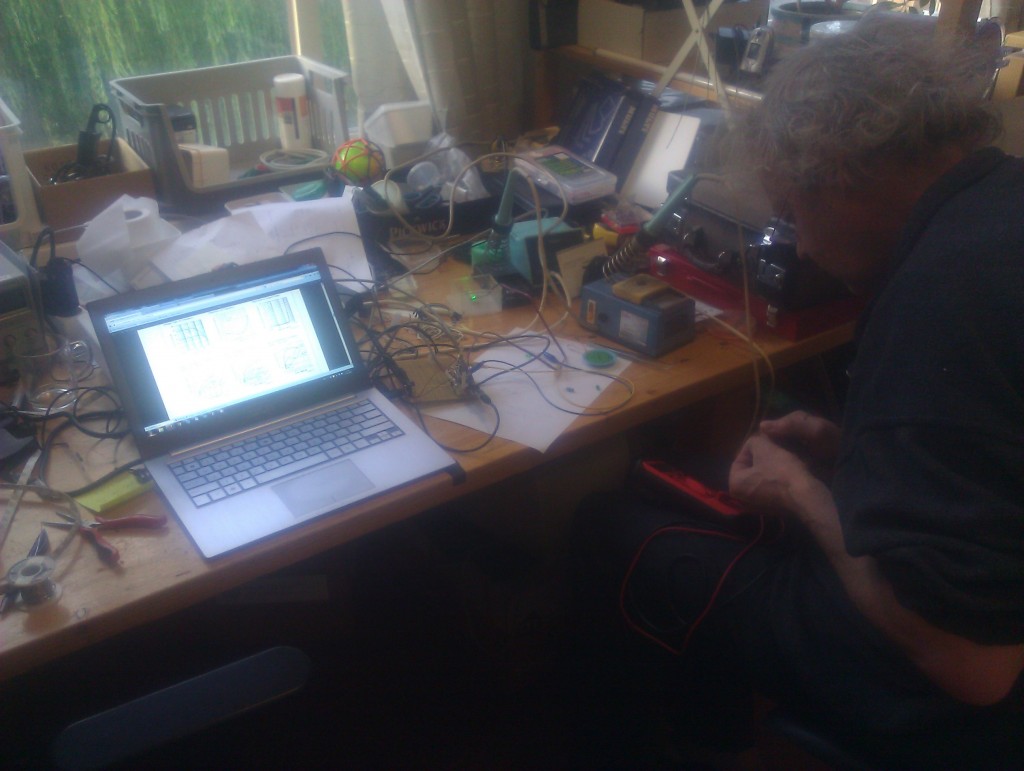
I’ve spend two days working on the @cocoon application. I got a lot of help from Rob, Eric and also from Wim. Despite all our hard work we didn’t manage to get the integrated piece to work.


It’s interesting how I had to scale down the functionality as development progressed. From the interactive prototype that measured noise level and heart-rate and adjusted its’ behaviour accordingly, I’ve now landed at a green pulsating cocoon that plays nature sounds. No measuring, no interactivity. And I still have to upload the final code for it to work… The isolation mission starts in an hour and I hope I have time to finish the piece so we can at least experience something.

The main hurdle was the unpredictability of the hardware. Especially the noise sensor is crap or perhaps it’s broken but it behaved completely unpredictable from the start. Outputting a lot of zero’s and just plain noise with very little relation to the actual sound level. Only peak noises stand out but not when there’re several in succession… Rob says it is oscillating heavily and that it would take two weeks to sort it out and really have a reliable sensor.

I bought a new version of the pulse sensor, the amped version. On it’s own it worked quite well after some initial calibration. But it had to be integrated with the pulsating green light. Rob wrote a special buffer library so I could use the internal clock that was already in place for the heart-beat sensing. We got that to work together. But if we added the sound sensing the whole code became unstable.

After that we tried the solution using a switch to activate the two parts of the system: relaxation and blue light (just because it was so nice). During that process we discovered a problem with the relay used to switch on the stereo sound playing on a separate MP3 player. We had a major meltdown on Monday during which the IC was destroyed. Last night at eleven we discovered that also the relay was dead. It will only switch on.
Probably because it was so late we didn’t even get the fading to run, but I think I solved that on the train going home. So in isolation I’ll try to get the most basic mode running. Which is probably where we should have started…

Trying to build this system in a couple of days has been a very educative experience for me. I’ve learned a lot for Rob and Eric who are real pro’s. According to Rob testing time is three times the time spend on development… I’m beginning to see he’s right.

A couple of hours later I was able to get the cocoon working. Now I just have to put in up in the Seeker.

@cocoon

Last week I joined the Seeker project, a co-creation project by Angelo Vermeulen exploring life in space(ships). It’s been really inspiring so far as living in space combines knowledge from the fields of architecture, sustainability, farming, water and power supply and Quantified Self. The latter being my addition, of course 🙂

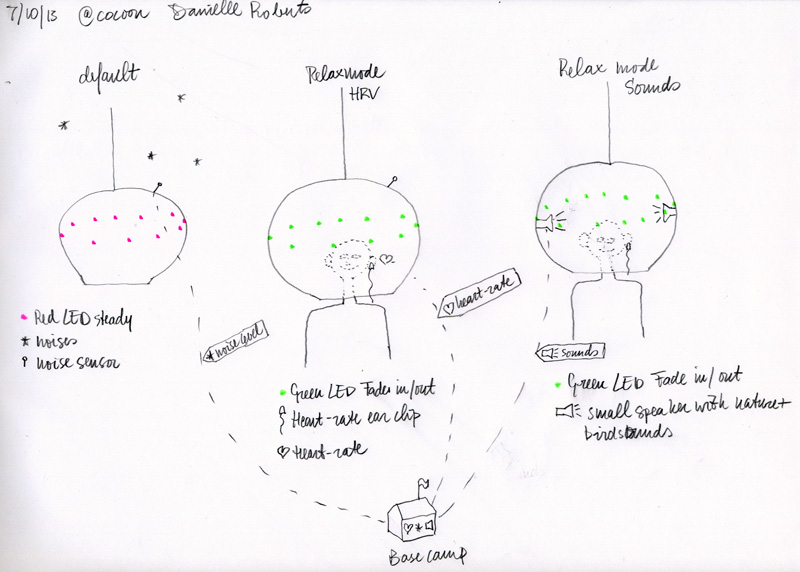
Together with architecture master students from the TU/e I’m looking into the interior of the ship which will be based on two caravans. As life in a spaceship is crowded and noisy my aim is to make a quick and dirty prototype that will:

  • detect the noise level
  • detect the users’ heart-rate
  • promote relaxation by pulsating light and sounds from nature

Noise level, heart-rate and soundtrack will (hopefully) be send to the base-station so people have a life indication of the status of the ship and the people living in it.

This is the sketch:

Today I’ll have a talk with the technicians for MAD to see what is possible. I’m thinking of using the following sensors:

Heart-rate: http://floris.cc/shop/en/sensors/731-pulse-sensor-amped.html

Noise level: http://floris.cc/shop/en/seeedstudio-grove/239-grove-sound-sensor.html

Playing sound: http://floris.cc/shop/en/shields/155-adafruit-wave-shield.html

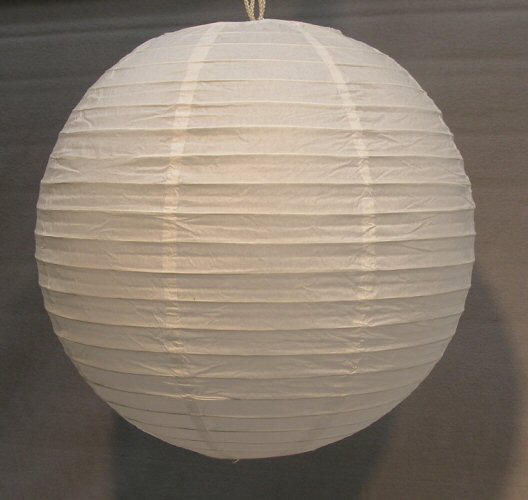
The cocoon itself will be the good old paper lamp:

e-Textile and data visualisation

Report of the meeting “Wearables and data visualisation” 13-6-13 @ V2_

Present: Ricardo O’Nascimento and Danielle Roberts (organisers), Anja Hertenberger, Meg Grant, Beam van Waardenberg

Skype: Annick Bureaud

Program:

– Introductions

– Look at and discuss examples from the web collected in a Pinterest board (http://pinterest.com/docentnv/wearable-dataviz/)

– Life demonstration

– Discussion

– Practical stuff

When preparing the meeting Danielle noticed that there are a lot of wearable viz that use knitting. We discussed why this is so. Data is logically related to patterns. Technically the Brother machines enable you to make your own patterns and connect them to an Arduino which can get input from a data stream. A drawback is that it can’t be live for most streams as the machine is too slow. We looked at the Neuro-knitting project and wondered if this is the real brainwave data? How close is the link to the actual data?

Ebru’s social knitting project where good news and bad news results in a change of colour while knitting is more a form of data logging. But it’s in real time. Other examples are: the conceptual knitting project: http://www.leafcutterdesigns.com/projects/creative-knitting-projects.html

What is data visualisation as opposed to data logging for example? Beam gave a clear explanation. Numbers are represented in a way that humans can understand. An RGB image is actually numbers transformed into colours. Our brain is the best data visualiser/interpreter. It simplifies the complex reality into something humans can grasp. So simplification is another essential. But it can easily become reduction. With reduction people lose the freedom to interpret all the layers of meaning. To get meaning from data combination of different sources and colourations between these sets is key.

Why is so many data on clothing static? To have dynamic data you need to work with electronics in clothing. As yet there is no fibre that can act as a carrier of information. Nano technology will be able to do so.

Maybe wearables are more suitable for data collection and screens more for displaying, Meg wondered? Screens are especially useful when looking back at collected data. And we all now carry our own personal screen with us in form of our Smartphone. Despite the drawbacks displaying data on you body can be significant Anja argued. Like people walking around with a sandwich board the wearer becomes part of the information. Or the funny guy at a party wearing a t-shirt with some crazy text on it. You can communicate about it. It can be seen as an extension. On the other hand part of your own identity is lost in transmitting the information.

Textile has a history as information carrier. Think about traditional embroidery to tell a story. And the use of colours and special gowns in different religions. This however has little relation to what we call data today. Data visualisation deals with Big data where data sets are combined, correlated and represented so we can derive meaning from them.

We’re still telling stories with data. This can take the form of life-logging. Ricardo’s Rambler shoe can be classified as a life-logging device. You can trace back your life from the track you’ve walked and share it on social media. Memoto is a company dedicated to life logging. Here too the device only captures images and GPS coordinates and the story is build in the database on screen.

Beam showed his brand new wearable that visualises space data from the sun. This is space data we can relate to. With other space data the connection is too thin and we lose interest. This wearable is a good example of simplifying a complex phenomenon, solar flares into an appealing visualisation that is dynamic but not changing too fast.

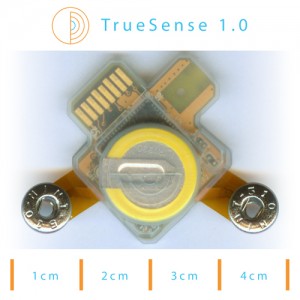
Danielle demoed an example of a wearable as a data collector. The True-Sense kit is a tiny bio sensor that can capture posture, EMG, EOG, EEG and Electrosmog. It can capture in real-time and log data. Brainwaves during sleep and meditation, activity, heart-rate, etc. All for €35. We are all very enthusiastic about it and will be organising a hands on meeting around it to explore its possibilities.

The practical stuff concerned the quality of the remote participation. This is very poor. Melissa suggested earlier that the e-Textile group should get a better microphone (±€120). Objections to this proposal were: who will own the microphone, will it help, isn’t the connection quality the main bottleneck? Our first step towards improvement will be to try out Google Hangout. So the next meeting we’ll be using that platform.

Quantified Self Conference Europe 2013

For me the quantified self conferences are like coming home: getting inspired by hundreds of people who share the same passion. It is hard to make a choice but in this post I would like to list my top three experiences of this QS conference edition.

1. Lonely at the top is the TrueSense wearable bio-sensor kit. It is “the first affordable, ultra-compact, ultra-low-power, bio-signal acquisition kit that allows bio-signal capturing anywhere, any time and on multiple body locations.” And oh yeah, it costs 35 Euro and is OpenSource(!)

I’ve had a nice half hour demo from Fu-Chieh Hsu the inventor and manufacturer of this sensor set. It can track: brainwaves, heart-rate (and deduce breath-rate from that), muscle tension, movement, posture and electro smog. Both real-time (using wifi) or as a logger (it can store at least 11 hours). The nice thing is that you get the full spectrum of waves. It is raw data, not ‘cleaned’. So you yourself can separate muscle movement from brainwaves for example. Another great thing is that you can use several of them on different places on your body. And there is the ability to set markers using the two buttons on the controller.

I haven’t had time to experiment yet. But watch this space for applications and experiments in the near future.

2. My second choice is my own breakout session “Tracking Breathing as a Unifying Experience” which I’ve described here. The reason for it being in my top three is that is was such a valuable experience to get feedback on my new wearables. The participants were enthusiastic and genuinely interested in the topic. It has really given my project a boost.

3. Last but not least are the nice and interesting conversations I’ve had with so many people. Every break I’ve met new people and learned about they’re ideas and projects. No matter at what table I sat down, it was always inspiring. That’s what makes this conference so great. I’m looking forward to the things that will emerge from all those conversations.

There was of course a lot more to see and hear about. Here are some of the runners up (in no particular order): Poikos to make a 3D image of your body with your smartphone (without taking your clothes off), LifeSlice for capturing webcam images of your face and screenshots. Things I’ve been thinking about and working on too. Unfortunately only for the Mac. Empatica for real-time stress measurement in teams. This is closely related to our e-Pressed project. There was Memoto, a life logging device which was discussed in a broad discussion. I’ve had plenty of experience with life logging in my project North-South feeling back in 2008/9. I also included heart-rate and pictures taken in the bathroom and toilet. Using Memoto will definitely reduce time spend on data cleaning and parsing. The last project I want to mention is One year in paper by Merel Brouns. It immediately reminded me of my recently finished piece Reversed Calendar.

Merel logged one year of her life in an analogue way using coloured tape and paper. I liked her addition of the daylight hours, using grey for night time.

And of course lots more…

breathing_time at the Quantified Self conference

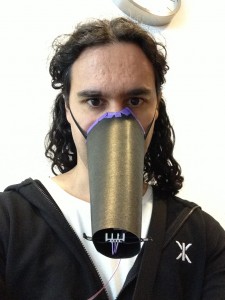
On May 12th I lead a breakout session at the second European quantified self conference in Amsterdam. The goal was to exchange experiences in breath and group tracking and to demo the new, wireless version of the breathing_time concept.

I started the breakout with an overview of the previous version. We soon got into a discussion on how hard it was to control your breathing rate. One participant used an Emwave device to try and slow down his breath rate. He could never quite make the target and therefore could never reach heart coherence which is frustrating. In my view the way to go is to become more and more aware of your breathing without intentionally wanting to change it. I went from chronic hyperventilation to an average breath rate of 4 times per minute without trying. Doing daily Zen meditation for lots of years has done it for me.

As usual people saw some interesting applications for the device I hadn’t thought of like working with patient groups. Another nice suggestion was to try out the placebo effect of just wearing the cone.

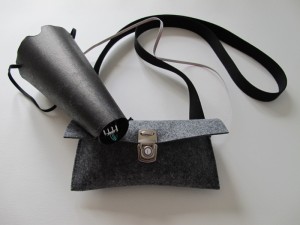
When it was time for the demo people could pick up one of the breathCatchers:

I’d managed to finish four wireless wearables. Working on 12 volt batteries with an Xbee module and an Arduino Fio for transmitting the data.

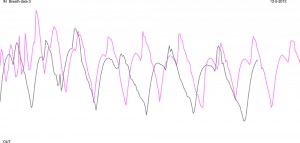
After some exploration we did two short breathing sessions so we could compare. The first was to just sit in a relaxed way and not really pay attention to the breathing (purple line). The second was to really focus on the breathing (grey line). The graph below shows the results:

Participants could look at the visual feedback but I noticed most closed their eyes to be able to concentrate better.

The last experiment was the unified visualisation of four participants. I asked them to pay close attention to the visualisation which represented the data as four concentric circles. A moving dot indicates breathing speed and moves depending on the breath flow.

It was fascinating to watch as the dots were moving simultaneously a lot of the time. However when asked how this session was experienced most participants saw the exercise as a game and were trying to overtake each other. They used “breath as a joystick”, to quote one of them. This was not my intention, the focus should be on the unifying aspect. I got some nice suggestions on how to achieve this: give more specific instructions and adapt the visuals to split the personal and communal data.

All in all we had a very good time exploring respiration and I’m grateful to all of the participants for their enthusiasm and valuable feedback.

printing and constructing

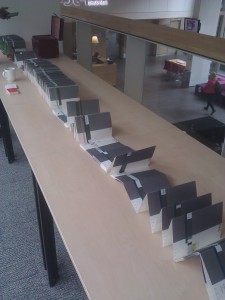
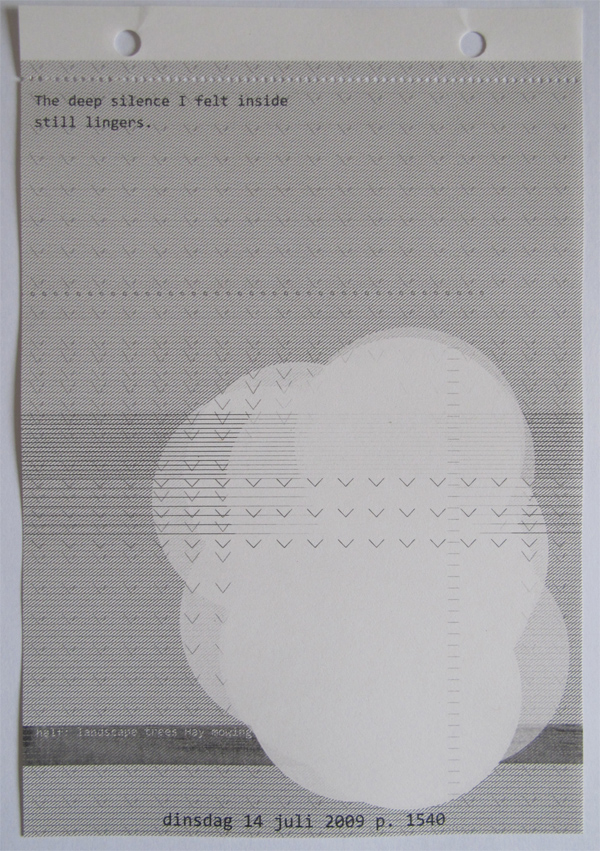
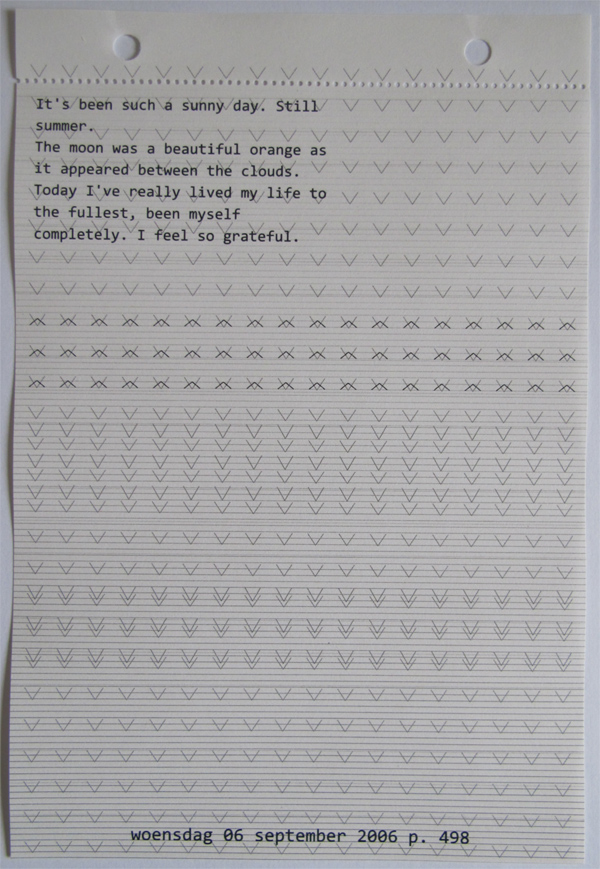
The worlds thickest block calendar is finished. Last week was spend on printing the 2865 pages, perforating them and constructing the calendar. The printing turned out to be more of a challenge then expected.

The inner peace visualisation consists of several layers of circles with varying transparency. Printing those pages resulted in extra thick lines in other parts of the print. To solve this the layers had to be flattened and saved in a PDF 1.3 document. As it took me quite some time to figure out how this is done, this is how I solved it. I opened the document in Acrobat and saved it as a PostScript file. I then opened it in Acrobat Distiller and saved it as PDF/X-3:2002. The whole process took a couple of hours because hundreds of pages had to be flattened. It took the printer around 8 hours to print the whole document! Thanks again to Tiggelman, they’ve done a great job.

After the printing was done I went to the print workshop at St Joost art academy, thanks to John too. Here I perforated 1400 pages by hand with the nice stamp perforation. After I got the hang of it and managed to perforate 4 or 5 leaves at a time it only took me around 6 hours in total.

Then the pages and tab sheets had to be cut and drilled (also done by Tiggelman). I then had two big stacks of pages which had to put into the right order. I then added the tabs and noted the years on them.

The final challenge was to actually build the calendar by pushing the pipes through the drill holes and slowly building one big stack. I had to use small stacks of around 50 pages. The whole was secured by using a long piece of threaded end inside the pipe and rings with wing nuts. Inside the pipe was also strong rope to hang the calendar from the ceiling.

Looking forward to the exhibition: FINAL SHOW 20 april – 23 june at Lokaal 01, Kloosterlaan 138, Breda. Together with 200 other artists.

calendar perforation

Being able to tear of pages is an important part of the calendar. So I’ve been investigating the possibilities. At first I hoped the printer, Tiggelman, would just do it for me. Alas their perforation turned out to be too vulnerable. The nice people at St Joost art academy and office supplies Benoist gave me the opportunity to test two different systems for perforation: one with a blade and the other with punch holes:

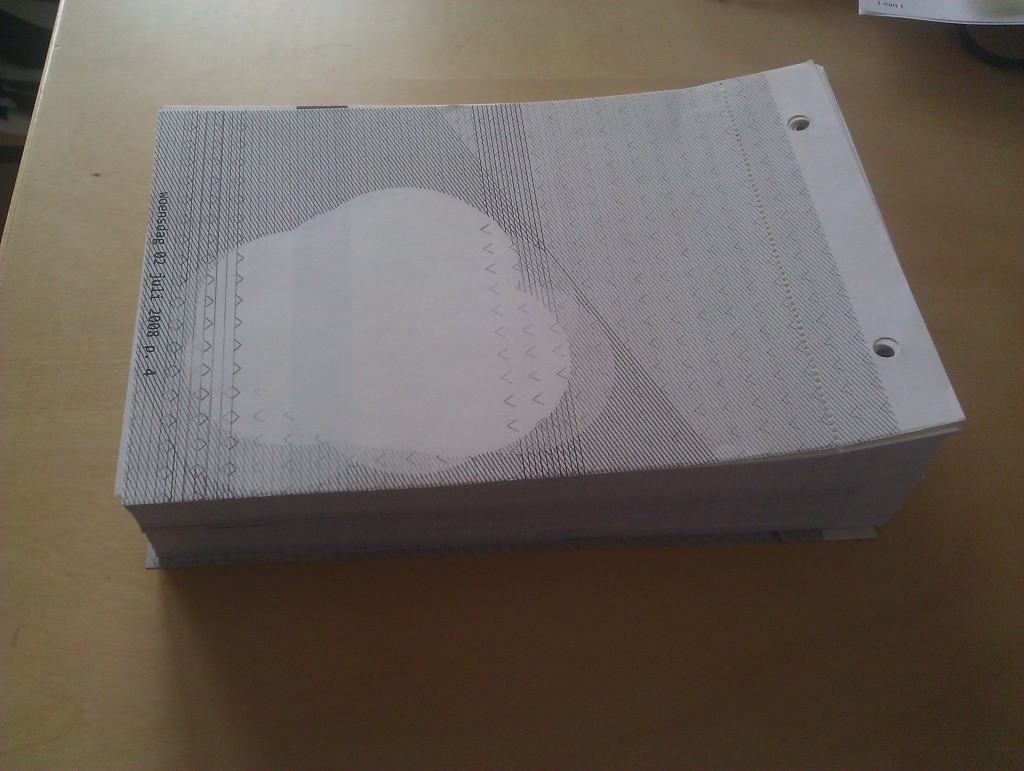
The top page has a stamp perforation. The stack is one year. This gives me insight into the size and weight of the calendar. The total weight will be around 5 kilogram. The thickness will be around 32 cm.

I still haven’t decided which perforation to use. I will have to do it by hand whichever one I choose. But the ease in which the papers can be torn off will be decisive.

flickr problems

Downloading the big format photo’s from Flickr turned out to be more trouble then I expected. Downloading the small format pictures went like a breeze, as I explained here. But on almost all the big files I got this picture:

I suppose I got kicked out. I only realised this when I wanted to integrate the pictures in the pdf so that was a bit of a set back. I had to think of a way to download the photo’s and be able to link them to the dataset. I’ve used two programs to download all my pictures from Flickr: Bulkr and PhotoSuck. Both contained the Flickr photo id in their file names. I found and rewrote a script to list all the file names, loop through them and save the pictures under their id used in the dataset. I keep being pleasantly surprised by Java and Processing. Eventually I only had to download only on picture by hand:

The next step is scaling the differently sized pictures to match the width of the pdf. I think I might also use the titles and tags of the pictures in a subtle way, I’m not quite sure yet.