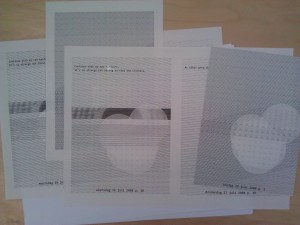
test prints

Today I went to make test prints and the results look very promising.

The people at Tiggelman repro were very helpful. They suggested I use a paper called Reviva which has a nice newspaper look. The lines I use in my design are only 0.4 pixels thick and the lighter ones were barely visible when I printed them on my printer. But at Tiggelman they’ve got a very good printer which can print those lines and gives very sharp prints in general. This is necessary as lots of lines are very subtle. They will print a test stack of 500 pages and do all the manipulations like drilling and perforating. I’m really looking forward to holding that first stack in my hands.

days of my life

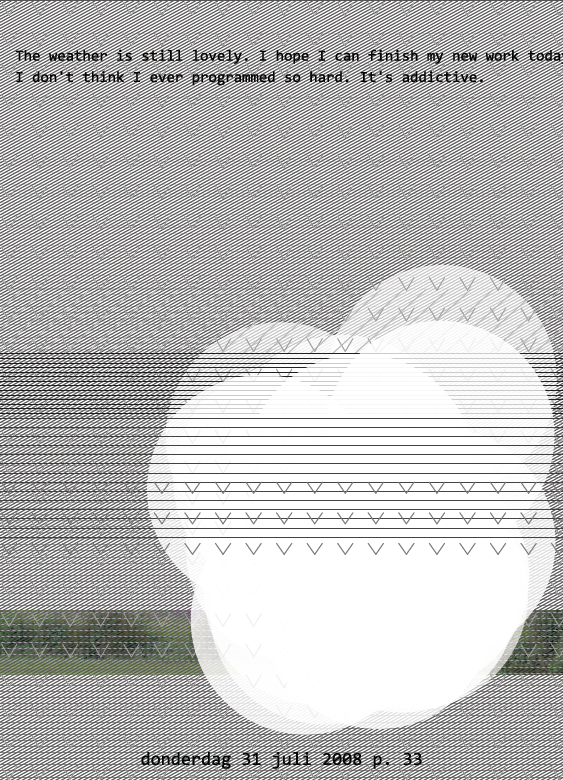
I’ve been programming hard to shape the pages that will represent my life in the calendar. I’ve used Marcos’ statistics to make a nice backdrop for my pages using the average of stress, energy, mood and inner peace values. Layered on top of that are the distinguishing values for the above parameters. I’ve also already incorporated the diary, haiku’s and photographs. It might take some tweaking still but the basics are there. See for yourself:

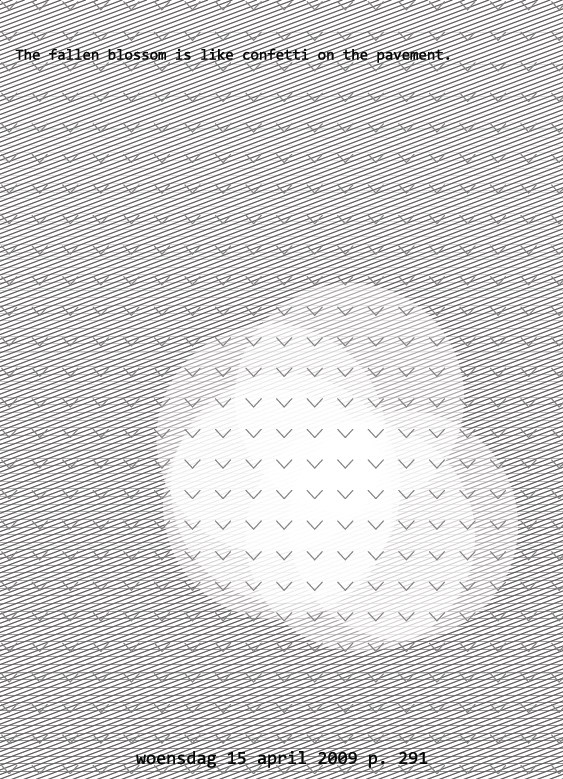
And a day with less data:

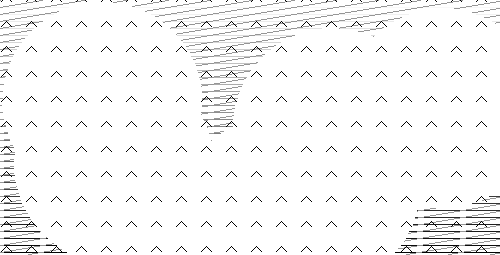
So the horizontal lines is the energy, diagonal is stress, the V or upside down is the mood and the white circles represent inner peace. All vary in colour and repetition depending on the value. I do love the different patterns that are drawn. Quite surprising.

working with data

I’ve been experimenting with the design and data visualisation using the personal data values: mood, stress, energy level and inner peace. Depending on the data value the lines, shapes and tone of each visualisation varies. This will create a different structure for every timeslot in every day.

Inner peace will be a big organic and mysterious shape.

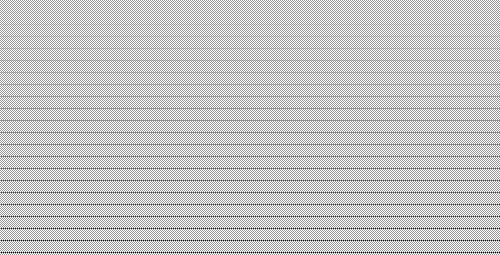
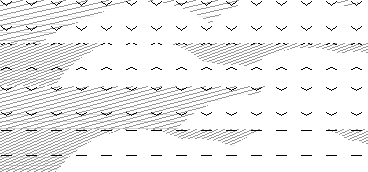
Energy and stress level will be pictured using horizontal an vertical lines respectively. The upper image is average energy and stress level. The lower is low energy and high stress.

Mood will be an arrow head/smiley pointing upwards or downwards. It is the most upper layer, clearly visible on the peace shape.

This is an experiment with combined output for 4 timeslots using real data. It gets a bit busy and the lines in different directions are making me feel a little giddy. So work to be done but it’s a promising start.

working with images

The calendar contains 863 photographs taken over the last eight years. Some days have multiple pictures most days have no pictures. Using a double loop I loop through the days again and for every day I loop the entire array to get the days where I took more pictures.

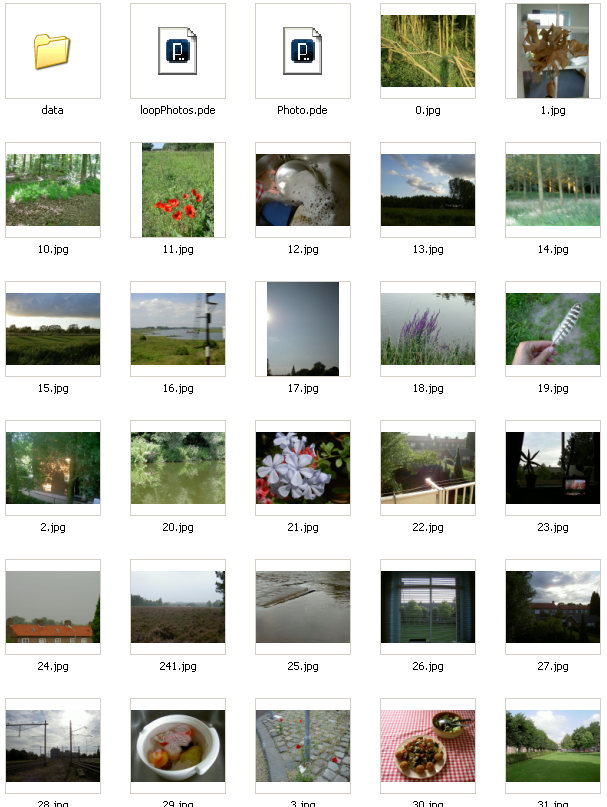
Once I knew I could detect all the images for every day I had to reconstruct the file name from the csv file containing the photo meta data which I created with the phpFlickrSync application which I described earlier. I wanted the pictures on my hard drive so it will be more stable once I start creating the pdf files. For that purpose I discovered this great Processing function called saveStream(). It takes just a file name and an url parameter. In my big loop I downloaded the files in medium size and renamed them to the index in the array with photo data. In fifteen minutes I’d downloaded and renamed all the 863 pictures. This is part of the result:

virtual to paper

I managed to convert the micro-diary to PDF output. It’s quite moving to see my virtual diary which has spend almost eight years in a database printed on paper. There’s is no layout yet, that will follow later. I have to make sure the it is technically feasible and then I can start tweaking the appearance.

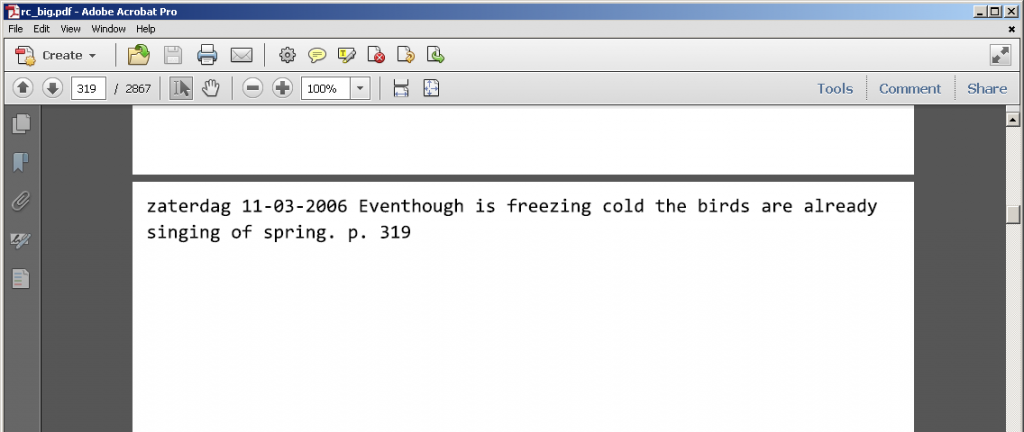
Update @ 11/3/13 I’ve now got a 2867 page pdf file of A5 format:

looping through the years

I’m starting a new data visualisation project. It uses some eight years of data from the numuseum website. In 2005 I started with a micro diary (255 characters per day) using custom software to update it every two hours. In 2006 followed my energy level and in 2008 inner peace and stress were added. All could be updated every two hours using the custom software. There are almost 900 pictures and around 60 haiku’s.

All this data will be integrated in an off-line visualisation: reversed calendar. This will take the form of an enormous tear-off calendar, where every leaf represents a day. There will be 2865 leafs in the calendar.

So I first have to get my head around the data sets. Luckily statistics wizard Marco Altini is helping to sort things out. He uses the very powerful program called R. Which can give you quick insight into data correlations. It was a bit embarrassing to discover how sloppy my data is. Notations have changed over the years and errors cause my program to halt.

At the moment I’m designing the leafs and doing some initial data accessing. I started out with the micro diary. I use Processing and Java to read in the data and at a later stage create pdfs for every day which can then be printed and made into a real tear-off calendar.

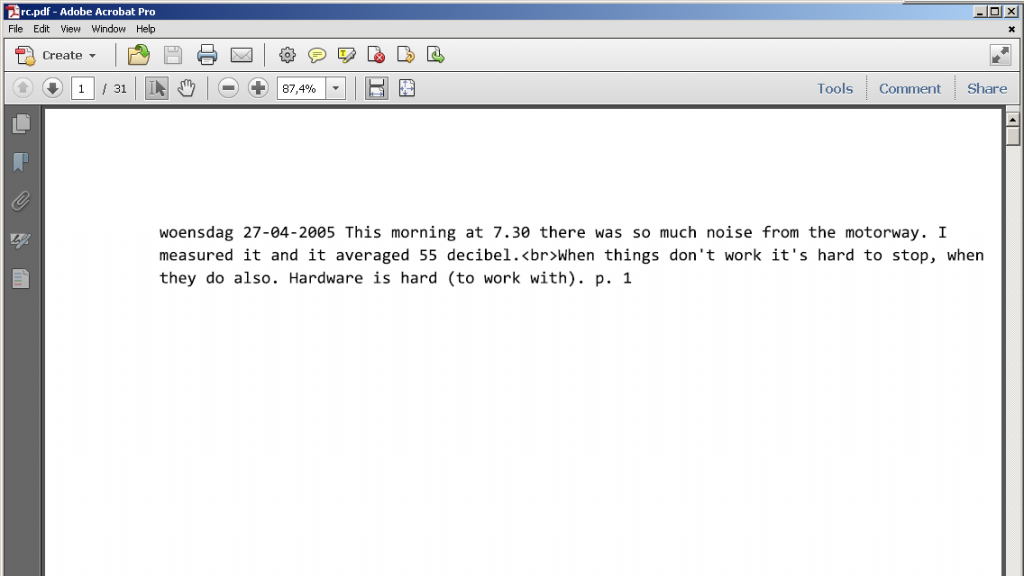
My idea is to make a big loop going through all the days from 27-4-2005 till 01-03-2013. I use the Java GreogorianCalendar class for that. The diary is in csv format consisting of a date and text string. I then compare every date with the date text string in the loaded data. It took some time to get the formatting right so the data can be compared as strings. I now have the first data ready to be incorporated into the pages. The printed output looks like this:

maandag 25-02-2013 // date of the page
Things are looking clear today.<br />Why does everything go more slow then you hoped? // diary text
p. 2861 // page of the calendar
dinsdag 26-02-2013
I hope I will learn the art of not worrying.<br />A nice conversation, new perspectives.
p. 2862

I want to share a little bit of code with you that I’m not using in the application but which might come in handy sometime. It lets you compare a date string to the incremented date (calStart):

Date d = new Date();
// make date
try{
String myDate = “30-11-2005”;
DateFormat sdf = new SimpleDateFormat(“dd-MM-yyyy”);
d = sdf.parse(myDate);
}
catch(ParseException e){
println(e);
}
Calendar tmpCal = new GregorianCalendar();
tmpCal.setTime(d);

if(tmpCal.compareTo(calStart)== 0){
println(“found”);
}

xbee hello world!

Today I’ve had my first success with communicating between two Xbees. Mostly thanks to this simple but clear tutorial. After installing the XCTU software with Thijs a few months back I had forgotten quite a lot of his private class “introduction to Xbee”. From his instructions I ordered 7 Xbee antenna’s and one Xbee explorer USB. My goal is to make an Xbee network without using Arduinos with the Xbees. This apparently is possible. But before getting to that point I had to make an Xbee “hello world” to grasp the concept and get the basics right.

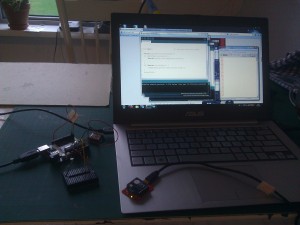
In this picture you see the a light sensor attached to an Arduino and Xbee antenna. The Arduino prints the measurements to the serial port. Through the TX and RX pin the Arduino is connected to the Xbee antenna. This sends data to the other Xbee antenna that acts as a receiver. The data is printed in red in the XCTU terminal on the right.

On to the next step: running the Xbee on a battery and programming the Xbee pins to read and send the wind sensor data. To be continued…

non-woven wearable

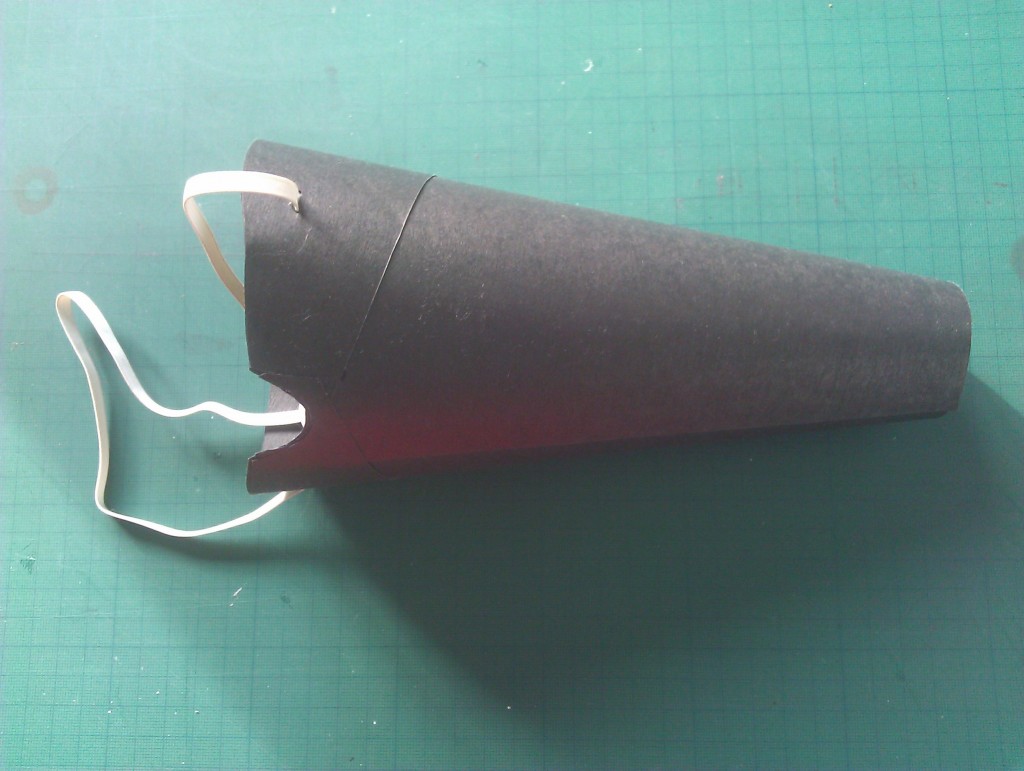
Because I’m extending the breathing_time project into a workshop I’m doing some research on non-woven materials to make the cones from. The first version was made of paper and felt. It looked very nice but wasn’t very practical. Paper folds and crumbles easily. The felt on the face gets dirty and as it was glued to the paper I couldn’t replace it. The department of wearable senses from the TU/e kindly gave me some samples to experiment with. These are the results:

Lantor producer of all sorts of non-woven materials:

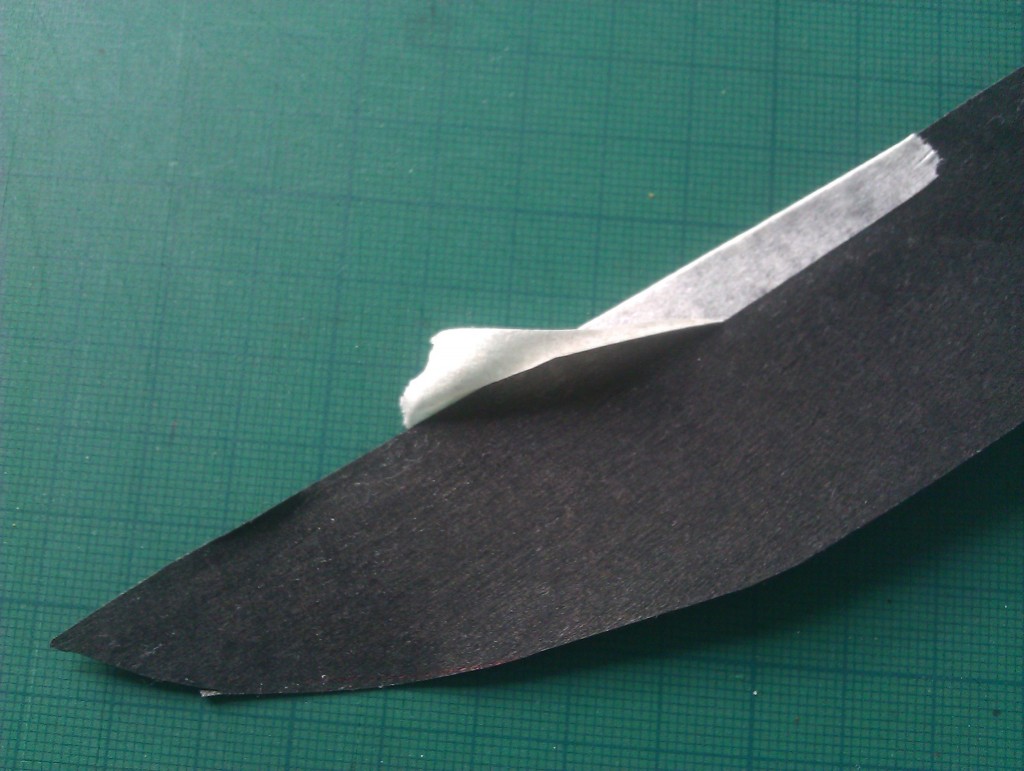
To start of with the best one. This is a thin, black non-woven. It’s very easy to work with. Can be glued with just ordinary collall glue. It sticks very well. The ease of working reminds one of paper. It has some nice extras. You can use sticky tape on it and you can remove that tape without leaving a trace, even after a few days:

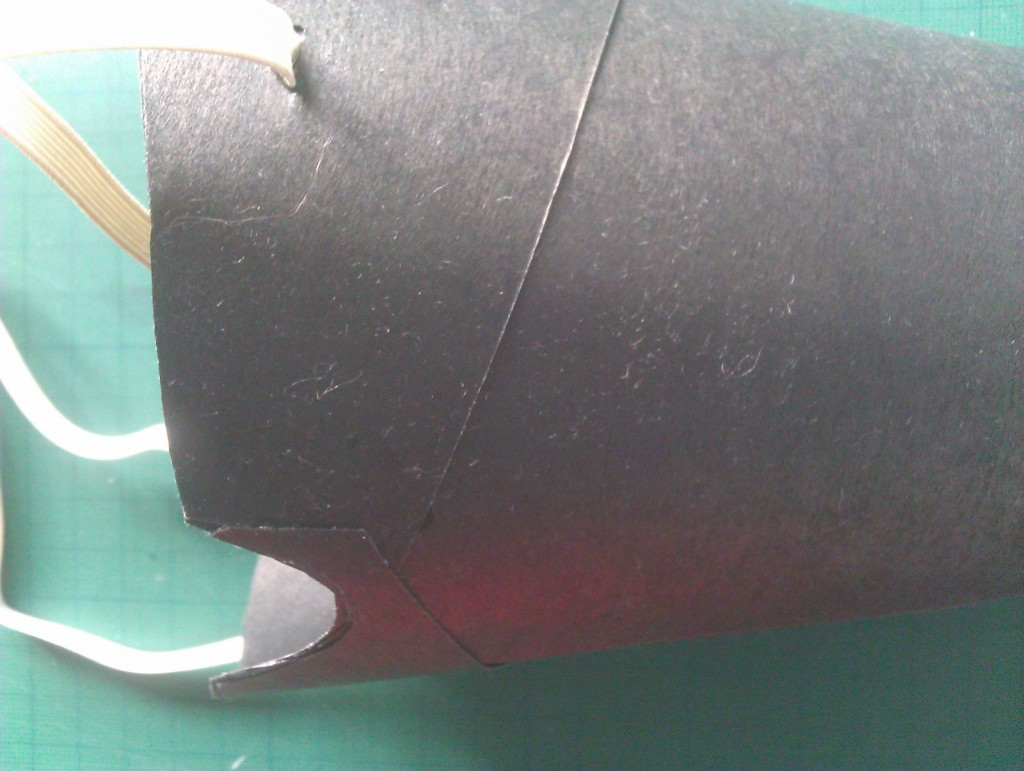
This is very useful, it allows me to make a replaceable, protective edge. The bare edge is too sharp on the face. You can also glue two layers on top of each other to make the cone more firm. This has a very stylish appearance:

You can just use scissors to cut out the shape. And it doesn’t tear like paper. So attaching the strap is no problem.

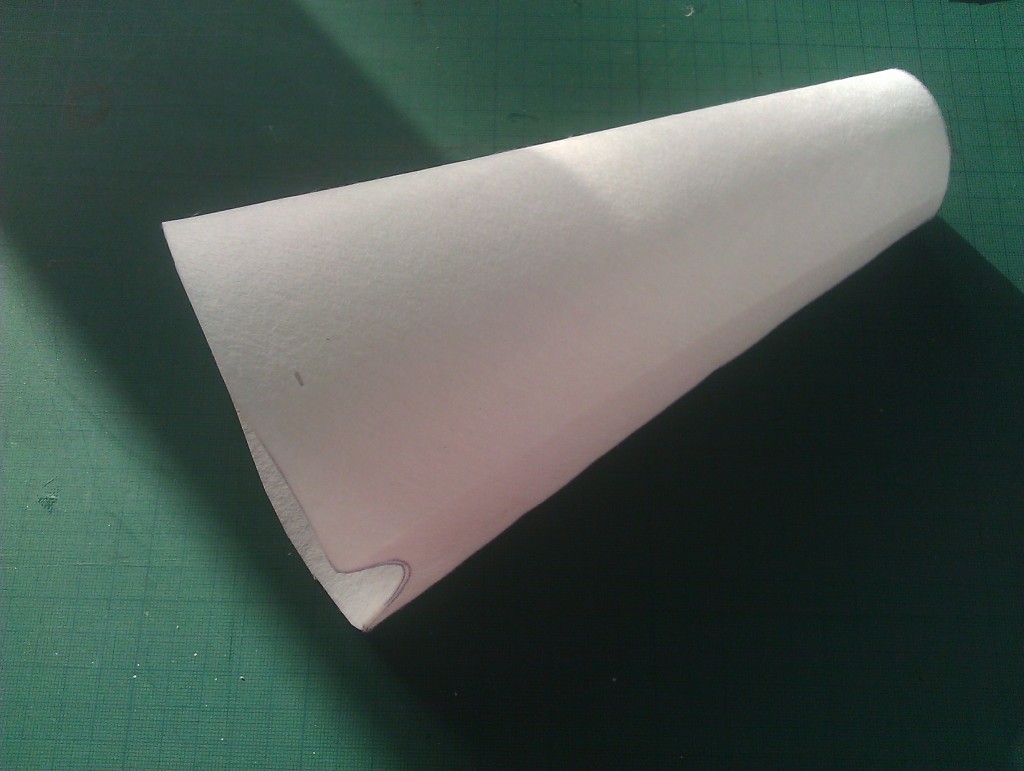
I also tried another non-woven by Lantor. It has a felt like appearance. Very nice but it is too floppy for my purpose and quite hard to glue:

Colbond producer of all sorts of non-woven materials:

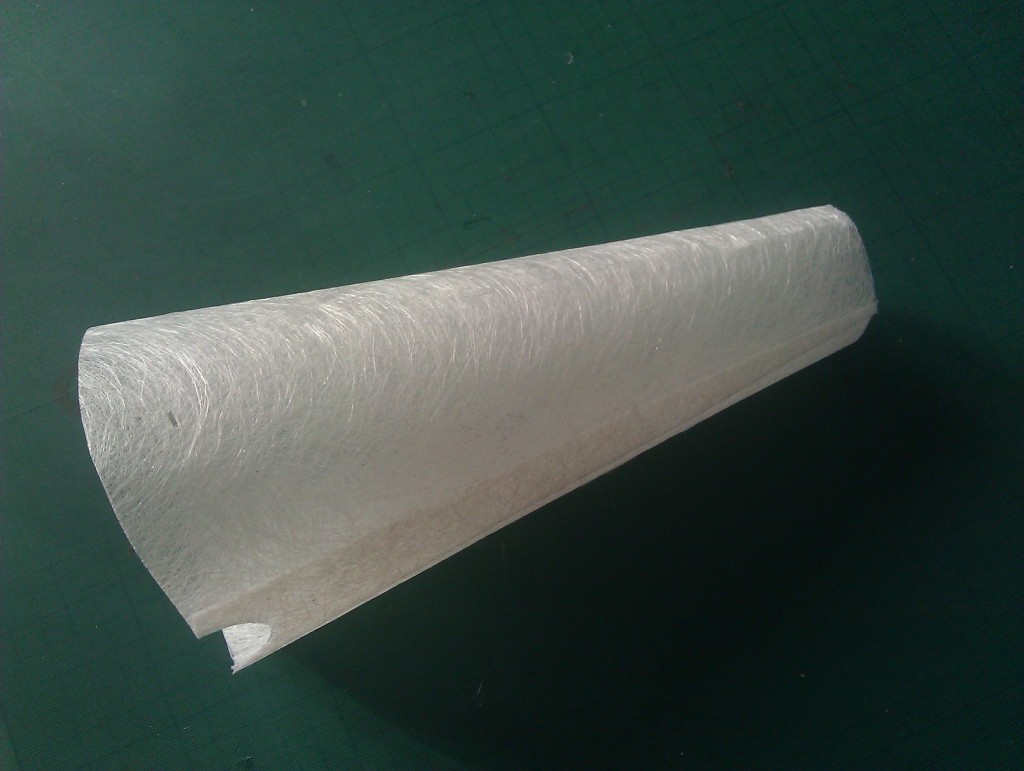
This semi transparent, thermally bounded non-woven has a very appealing look. It is stiff, even a bit sharp on the edges. I was really looking forward to trying this out but the result was a bit disappointing. It was hard to glue due to its’ open structure. It also turned out to be very brittle. A fold doesn’t go away (view right end). In that sense it is worse then paper. As I will be reusing these cones with different people they have to stay clean and in shape. This one didn’t stand that test.

big data hackathon

The Big Data Visualization Hackathon: ‘Making the healthy choice in any environment’ took place October 12 – 13 at the High Tech Campus in Eindhoven where 10 teams of hackers with various backgrounds created solutions in the area of health care.

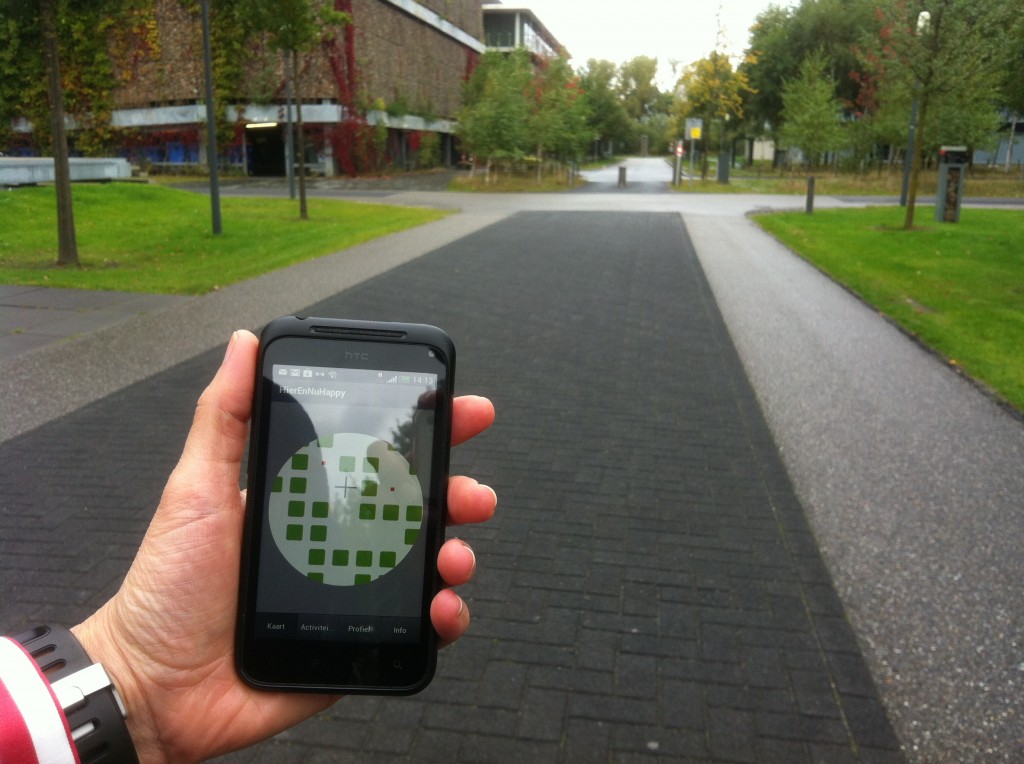
I participated with Eugene Tjoa. We created a mobile app that acts as a personal compass guiding you to the areas most beneficial for you.

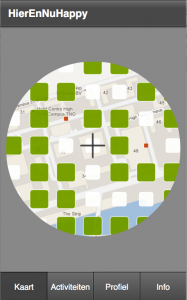
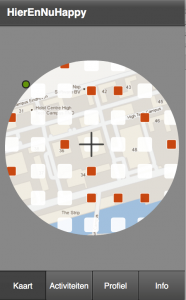
After filling in your health profile you can choose an activity. By combining different datasets the application overlays the vicinity with a grid that indicates better, neutral or worse areas. By clicking on one of the tiles you get more information about the advice. For example if you are suffering from asthma areas with high pollution will be red, clicking on the tile will tell you more about the air quality.

If this area is not good for you but a little bit further on it is better this will be indicated by a green circle just outside the map. The position of the circle indicates the direction you should be heading:

Despite all the talk on open data it was hard to find suitable datasets, especially ones with a finer grain. It was a very docile experience for us. We learned a lot about making apps with Flex. Philips provided a nice atmosphere, good food and inspiration. All in all a very good experience.

Karuna clouds

Maha Karuna Ch’an, de zengroep onder leiding van Ton Lathouwers bestaat dit jaar 25 jaar. Vanuit de groep kwam het initiatief om iets doen met teisho’s (zen toespraken) die Ton in al deze jaren heeft gehouden. Ik heb in de 15 jaar dat ik bij Maha Karuna kom vele toespraken gehoord. Soms zijn ze heel ontroerend, bijna altijd inspirerend. Mij werd gevraagd of ik vanuit mijn kunstenaarschap een andere, meer beeldende benadering had om iets te doen met de teisho’s. Omdat nieuwe media mijn medium is leek het me interessant iets te doen met woordwolken die je op internet kunt genereren. Het idee hierbij is dat hoe vaker een woord in een tekst voorkomt, hoe groter het wordt afbeeld. Dit is dus een nieuwe manier om inhoud te visualiseren, die veel gebruikt wordt in blogs. Ik was benieuwd hoe de teisho’s zich hebben ontwikkeld, is er een rode lijn te ontdekken?

Verkenning
Stap één was het verzamelen van zoveel mogelijk teksten uit zoveel mogelijk jaren. Dit bleek niet eenvoudig. Het materiaal was fragmentarisch, van vroegere jaren bleek er nauwelijks iets gedigitaliseerd. Ik heb besloten om alleen te werken met jaren met voldoende tekstmateriaal. Dit zijn de jaren 2001, 2002, 2007, 2008, 2009 en 2011.
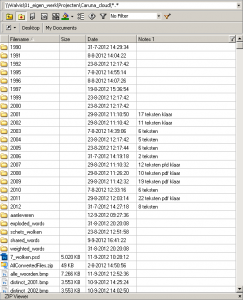

Mijn eerste idee was te werken met Wordl, een beroemde online tool, die fraaie wolken produceert. Deze tool bleek weinig inhoudelijke controle over het uiterlijk te kunnen uitoefenen, bovendien kon het niet zo’n lange teksten aan. Ik heb deze meer visuele tool aangevuld met de functionaliteit van Tagcrowd. Hiermee kun je woorden uitsluiten en woordaantallen weergeven die je als tekst kunt selecteren. Ik besefte dat ik zelf het een en ander moest programmeren om tot optimaal resultaat te komen.

Proces
Van verschillende mensen heb ik tekst bestanden gekregen. Deze moest ik ordenen, opschonen en onderzoeken wat echt bruikbaar was. Daarna heb ik de teksten van elk jaar samengevoegd tot één grote tekst en deze geupload naar Tagcrowd. Gaandeweg heb ik de lijst met uit te sluiten woorden uitgebreid en de verzamelde teksten diverse malen naar Tagcrowd gestuurd.
Zo’n analyse geeft al snel meer dan 500 verschillende woorden terug. Ik heb gekozen de meest voorkomende 150 woorden per jaar te gebruiken. Van ieder woord wist ik dan ook meteen hoe vaak het in dat jaar was genoemd. De resultaten kopieerde ik naar een tekstbestand. Dat zag er dan bijvoorbeeld zo uit: aarde (39) abe (117) allemaal (150) anderen (41), enz.
Het bleek dat Wordl een advanced setting had waarmee je in plaats van de lange tekst, direct een lijst met gewogen woorden kon invoeren in het formaat woord:aantal. Ik heb in Processing een programma geschreven om de Tagcrowd resultaten om te zetten naar het Wordl formaat:
af:44
allemaal:88
beeld:90
beelden:52
beetje:59
belangrijk:49
betekent:49
Deze gewogen woordlijsten heb ik geïmporteerd in Excel en gesorteerd op alfabet of meest voorkomend. Door de verschillende presentaties van woorden, kijk je op een andere manier naar de tekst, je ziet weer andere verbanden, andere woorden springen eruit.
Door zo te spelen met de woordlijsten en hun aantallen ontstonden de ideeën voor verschillende visualisaties. Ik vond de gewogen woorden in een wolk met mooie kleurtjes en lettertypen weinig betekenisvol. Gelukkig bood Wordl ook de mogelijkheid zelf middels een code (hexadecimaal) kleuren aan te geven, die heb ik uiteindelijk handmatig aan elk woord toegevoegd.

Visualisaties
Vooral alle visualisaties waren de lijsten met gewogen worden de basis. Ik heb hierin verschillende hoofdthema’s onderscheiden: samen, mystiek, sutra, tijd, zen, taal en overigen. Elk thema eigen kleur.
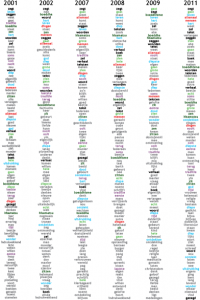
Pagina 1: van elk gekozen jaar de worden de 100 meest voorkomende woorden getoond. Ze zijn gesorteerd van meest naar minst voorkomend. Vormgeving en kleurtoekenning heb ik met de hand uitgevoerd in Illustrator.
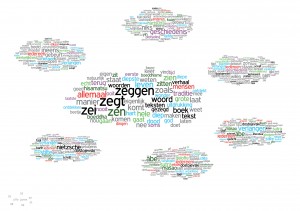
Pagina 2: Elk jaar heeft zijn eigen woordwolk, de centrale wolk bevat woorden die in alle jaren voorkomen. Ik heb een programma geschreven dat de zes lijsten met 150 meest voorkomende woorden doorloopt. Woorden die in alle lijsten voorkomen zijn bij elkaar gezet en het aantal vermeldingen van elk van die woorden is per woord bij elkaar opgeteld, deze bepalen de grootte van de woorden. Er waren in totaal 66 gemeenschappelijke woorden, variërend van 903 tot 252 vermeldingen. De kleurencodes heb ik handmatig aan de lijst toegevoegd:
allemaal:566:EF3B39
beetje:271:808285
boeddha:357:346734
boeddhisme:267:346734
boek:488:000000
diep:439:33C6F4
enz.
Hiermee heb ik een woordwolk gegenereerd in Wordl. Ik schreef ook een programma om de overige woorden per jaar uit te filteren en de aantallen bij elkaar op te tellen. Ook hier zijn kleurencodes handmatig toegevoegd en is voor ieder jaar afzonderlijk een wolk gegenereerd. (Zoals je ziet wordt Dostojevki lang niet zo vaak vermeld als Ton wel denkt.)
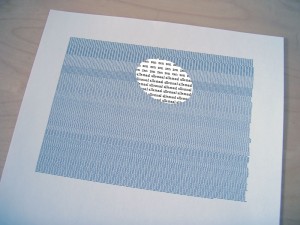
Pagina 3: Ik vond het ontroerend dat bepaald woord zo vaak is uitgesproken. Ik wilde recht doen aan die woorden en uitdrukken wat die hoeveelheden eigenlijk betekenen. Ik schreef een programma dat de meest voorkomende, gezamenlijke woorden zo vaak afdrukt als zij uitgesproken zijn. De kleuren zijn handmatig aangebracht in Illustrator.
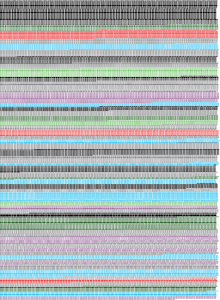
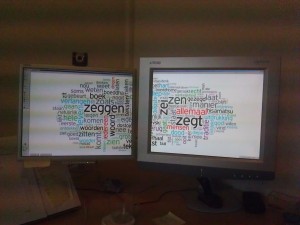
Pagina 4: Deze wolk toont de verzameling van de 150 meest voorkomende worden van alle jaren. Het programma dat ik schreef kijkt per woord hoe vaak het woord voorkomt per jaar. In het totaal bleken er 300 verschillende woorden te zijn. De kleurcodes zijn gekopieerd uit de woordenlijsten met kleurcode die eerder handmatig waren aangevuld. Het leverde een gigantische woordwolk op die ik over mijn twee schermen heb verdeelt om zo de kleinere woorden ook te kunnen vangen. Het kleinste woord, jan kwam 15 keer voor.
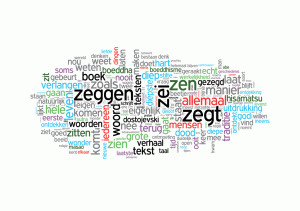
Voor mij was het heel interessant om te ontdekken dat de woorden die ik zo goed ken uit de toespraken van Ton mysterieuzer schenen door ze op verschillende manieren bij elkaar te zien. Ik heb ze teruggeven aan zichzelf.

Ik wil Maha Karuna Ch’an hartelijk bedanken voor het gebruik van de teksten. Verder dank ik: Karin van der Molen, Mieke Coenen, Maria Werkhoven en Jo Ampe voor het aanleveren van de teksten.