Virtual View: statistics for experiment 3

In experiment three I wanted to see if adding movement to visual content had a bigger lowering effect on heart-rate and subjective stress then just using a still. And I wanted to know if variables like heart-rate and skin conductance could be restored to or below the baseline following a stress stimulus. Sound accompanied the visuals and I used the same soundtrack for both conditions.
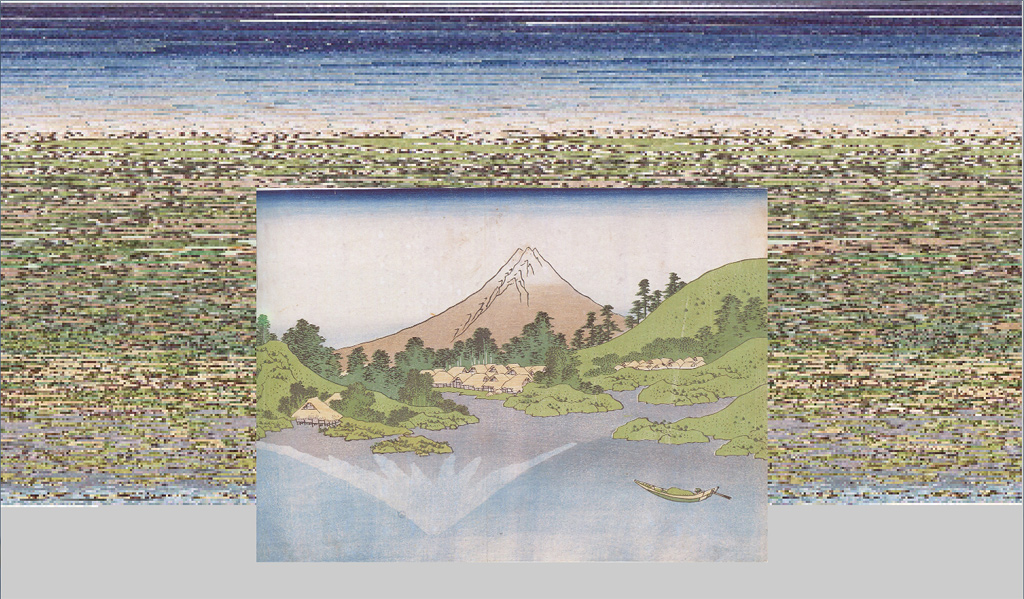
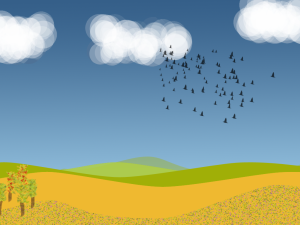
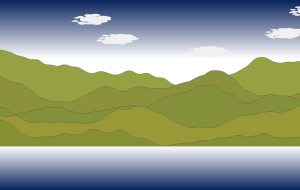
The animation consisted of a main landscape layout with different animated elements over-laying that scene. The landscape consisted of a blue sky with white clouds slowly moving over it. Three hills with shrubs in different shades of green and a blue water body with a cream coloured shore. The animations were started mostly in sequence so there were just one or two animated elements to be seen. This is aside from the clouds and the waves on the water body, they were visible most of the time.staticAnimationStimulus
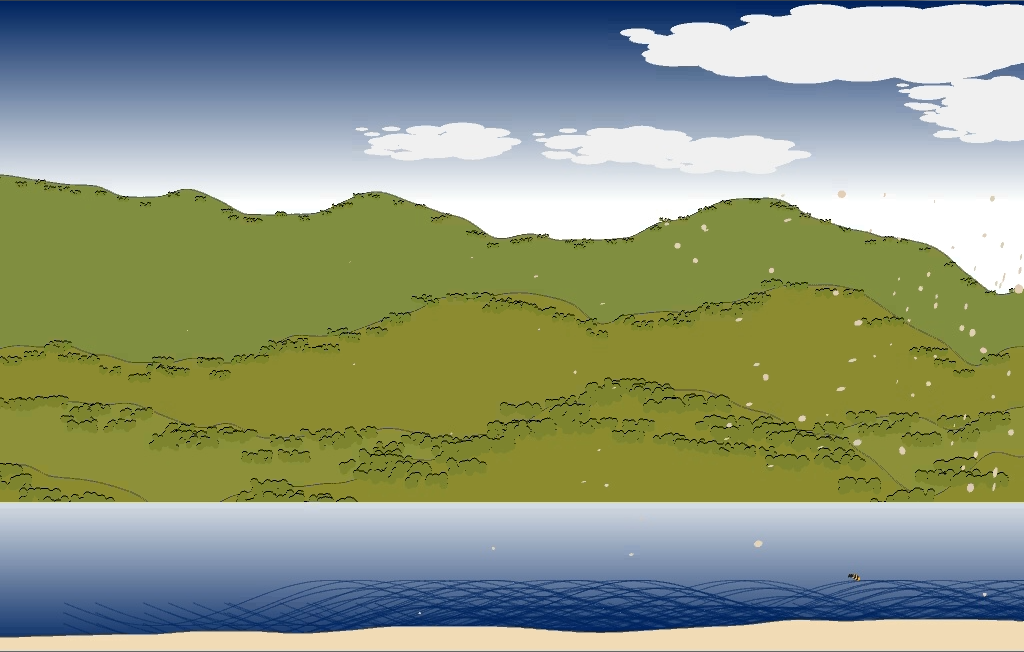
Animation still used in condition 2

Other animations are: big and small flocks of “birds” consisting of 150 and 5 “birds” respectively. They move in random directions within the frame. Blossom leaves flying from one side of the screen to the other. This animation also included a bee flying from one side of the screen in a slow, searching way. A final animation element are the butterflies. They flutter near the bottom of the centre of the screen and disappear after a random time span. The visuals are not realistic but simplified and based on the style of the old Japanese woodblock prints.
The sounds are inspired by nature but underwent a lot of computer manipulation. The sound is carefully synced with the imagery and movements on the screen.
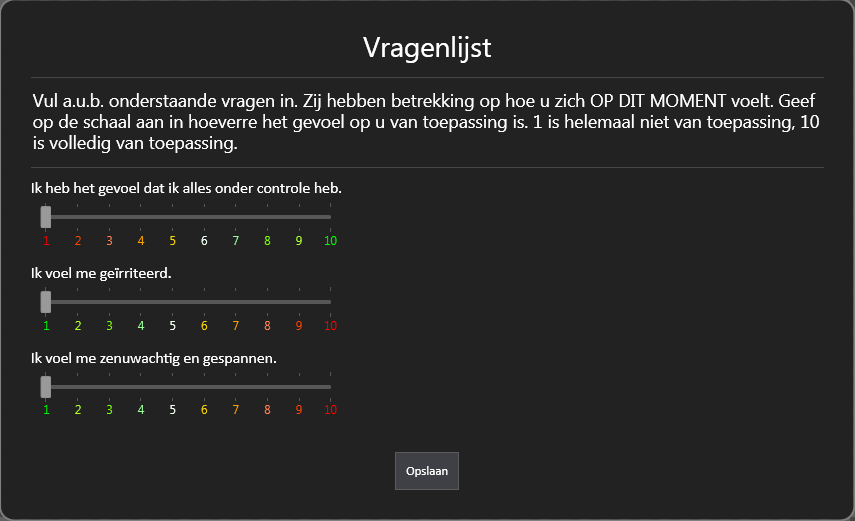
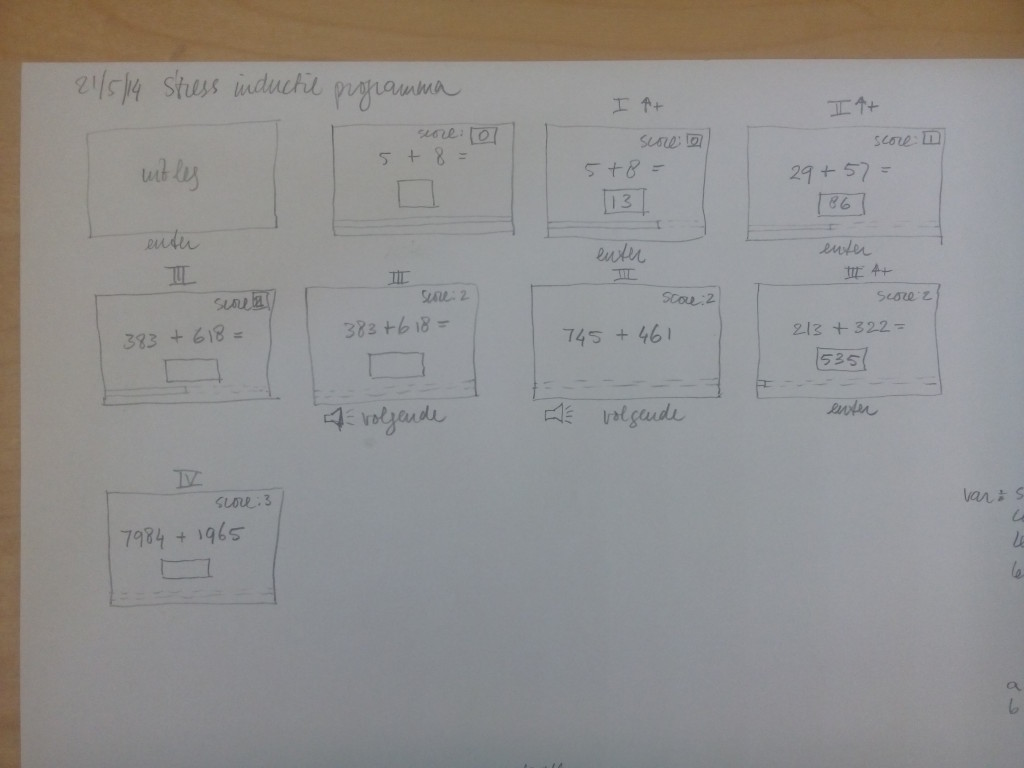
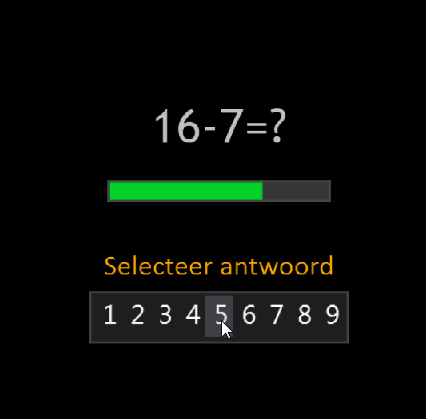
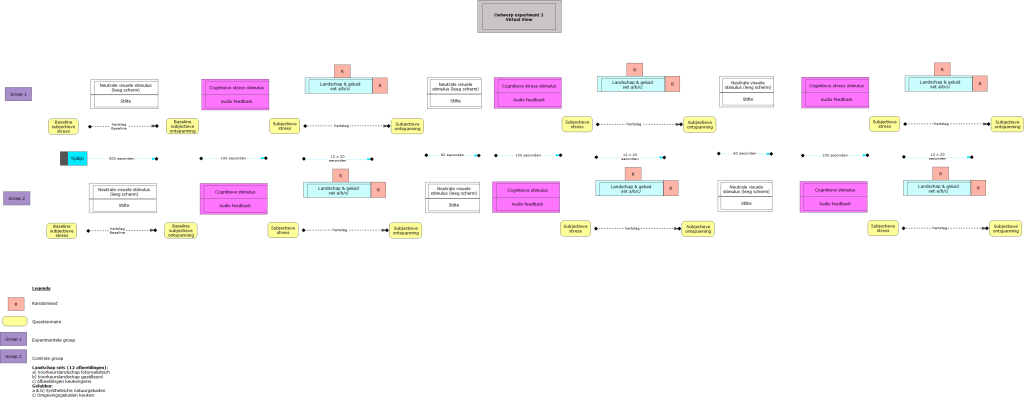
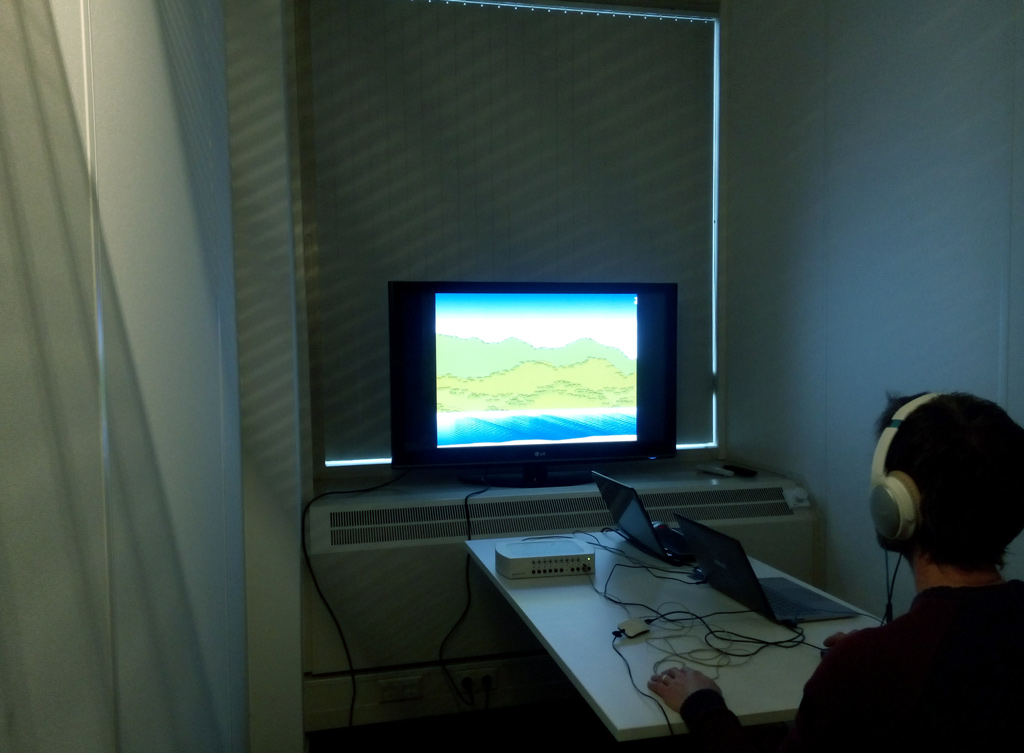
In both conditions I measured subjective tension (7 point likert scale), heartbeats per minute, heart-coherence and skin conductivity. The experiment consisted of three stages: a baseline measurement (5 minutes), a cognitive stress task (around two minutes), the audio and visual stimulus part (5 minutes). Subjective tension was measured before the baseline measurement, after the stress task and after the stimulus. For a full description of the lab setup and experiment view the previous post.

Sample
The sample consisted of a total of 33 participants, more women then men (75% over 25%), this frequency was the same for both conditions. They were mainly recruited from the art centre where the experiment took place, there were a couple of students and some members from the general public. They were randomly assigned to each condition. The maximum age was 71, the minimum was 20 (mean 41,1). One dataset was corrupt so I ended up with 16 (mean age 39,6) participants in condition 1 (animated landscape) and 16 (mean age 42,7) in condition 2 (landscape still).

Correlations
I’ve used SPSS 20 to calculate the statistics. I was curious if the heart-rate or heart-coherence would correlate with the subjective tension and/or the skin conductance. I could find very few significant correlations between the different variables. There are only significant connections between the different measurements of one variable. So the beats per minute (BPM) of the baseline measurement correlates with that of the cognitive stress task measurement and of the stimulus (landscape) measurement. The same is true for the Gavanic skin response (GSR) and the heart-coherence (HC). The only interesting correlation I found was a negative correlation between the baseline HC and the self reported tension (SRT) of the baseline and the stimulus. The could indicate that, assuming that heart-coherence is a measure of alert relaxation, perceived tension at the start and during the task the opposite of this alert relaxation state. But the correlation is weak (-496 and -501) so not much can be concluded from that.

Condition comparison
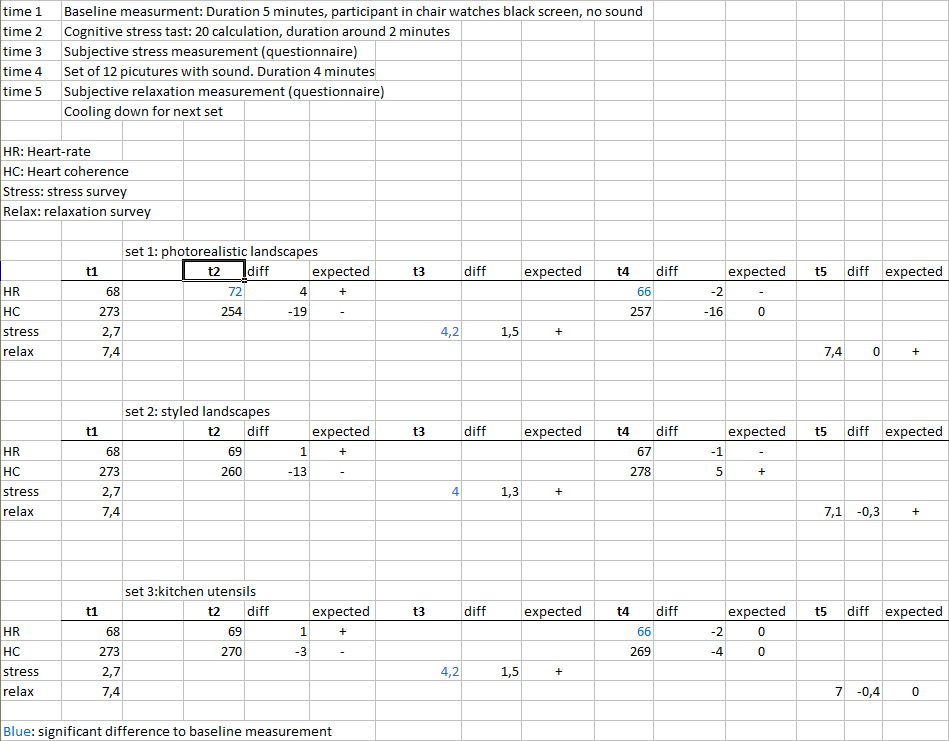
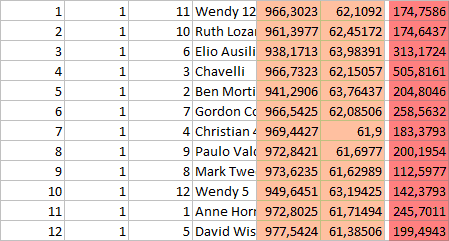
Before comparing conditions (with or without motion) I had to check if the stress stimulus had worked and if there was an effect for the audiovisual stimulus in general. Below you see an overview of the variables self reported tension (SRT), beats per minute (BPM), heart-coherence (HC) and galvanic skin response (GSR). The values for these variables are the mean values for the duration of the different parts of the experiment: Baseline (t1), cognitive stress task (t2) and stimulus (audiovisual material, both conditions) (t3). You can also see the expected direction of the variables. The significant values are printed in green.
results
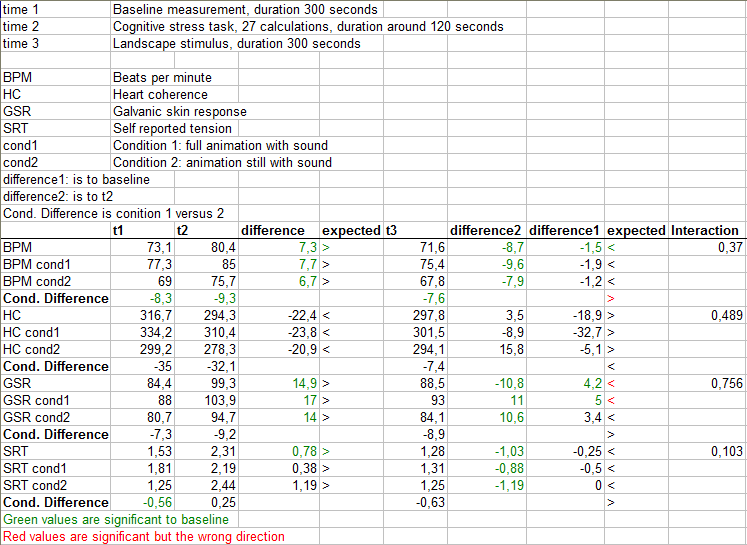
From the table you can tell that there is a significant difference between the baseline measurement and the cognitive stress task on the one hand and between the stress task and the stimulus. This is true for BPM, GSR and self reported tension. All values rose during the stress task and decreased during the stimulus presentation. As those measures are strong indicators for stress this indicates that the stress task worked and the tension showed significant variation during the experiment. Heart-coherence shows no significant changes.
For the heart-rate there was even a significant lowering of the mean compared to the baseline. Indicating that the BPM was even lower the when participants entered the experiment.

Of course I wanted to test if there was a difference in the variables between conditions, that way I could see if animation was more effective then using only a static image. As you can see from the table there were no significant results for either of the conditions apart from the skin conductivity (GSR). The skin conductivity is a measure for arousal, the more aroused the higher the value. I would expect the GSR to be low at the start, high during the stress task and again low during the stimulus presentation. The GSR values for the stimulus presentation were significantly lower then during the stress task but they were still significantly higher then during the baseline measurement. This indicates that the GSR levels haven’t gone back to the baseline let alone become lower then the baseline state. This might be due to the fact that it takes more time for the skin activity to go back to normal. The response is slower than for heart-rate measurements.
We can see a reduction in heart-rate for both conditions with a bigger reduction in heart-rate for the animation condition. But neither of these changes are significant.
For the self reported tension we see a significant lowering in the tension from the higher values during the stress task and stimulus presentation. This means that people felt significantly less tense watching the landscape than during the stress task. The perceived tension was also lower in the animation condition than during at the start of the experiment though not significantly so. We don’t see this effect in the static condition. For this condition the baseline was lower and the effect of the stress stimulus was stronger. The overall variation was bigger. So you can’t really draw any definitive conclusions from this data other then that the landscapes reduced arousal in both conditions.

Overall lack of significance of many of the variables in either conditions may be caused by small the sample or it may indicate that there isn’t enough difference between the conditions for it to be significant. This might be caused by the way the stimuli were presented. For the sound we used a high quality active noise cancellation headphone. The impact of the sound was big. The screen image on the other hand was rather small (84,5 x 61,5 cm). The effect of the visuals might therefore be less strong in comparison with the high impact of the sounds.

I was of course also interested in the overall differences between the conditions, especially for the landscape stimulus. When comparing the different measurement moments for BPM we can see that in every moment the heart-rate in the static image condition is lower. So the participant in the first condition already started out with a much higher heart-rate. During the stress task the difference is even bigger and during the landscape presentation the differences have become smaller. I had expected that the heart-rate in the first condition would be lower but the differences are so big to begin with that you can’t draw any conclusions from it.

So does animation have a more positive effect on heart-rate, heart-coherence, skin conductance and self reported tension? I’ve looked at the interaction between all these variables and animation but on non of the variables the effect is significant. The major effects are on heart-rate. A bit to my surprise there are absolutely no effects on heart-coherence. In the first condition we see even a (non-significant) lowering of coherence during the animation. I’m therefore not going to use this value to drive my animation as was my original intention.

Scene comparison
While analysing I got curious to see if there are differences between the scenes of the animation and sound in condition 1 and 2. The animation and accompanying sounds can be divided into 10 different scenes. During the construction of the video I tried to incorporate various animation elements. They become visible one after the other.
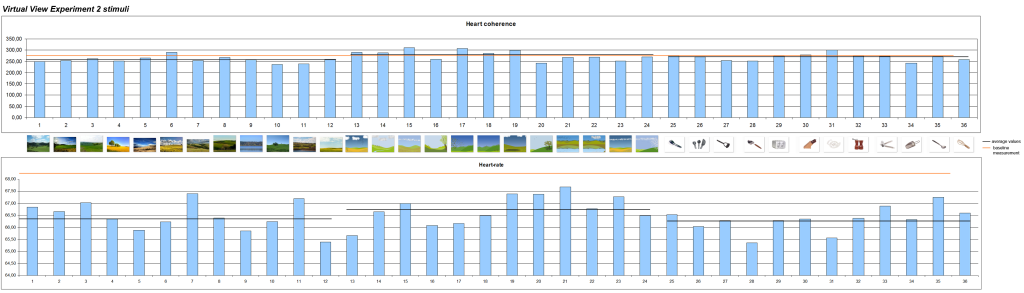
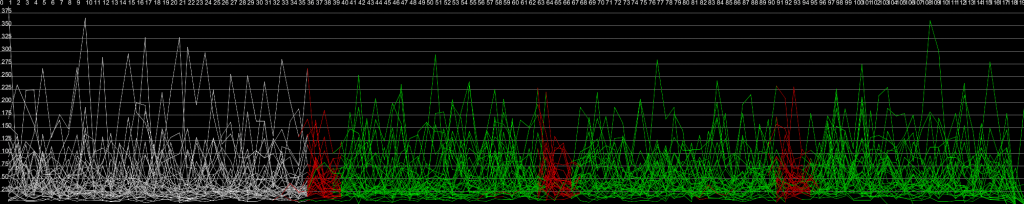
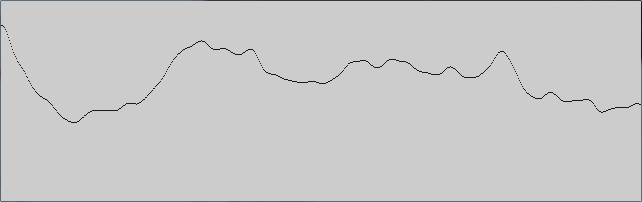
I looked at the effects on mean heart-rate because it showed the most results. I wrote a script to calculate the mean heart-rate for every scene and for both conditions. The results are show in the graph below.
scenesCompare

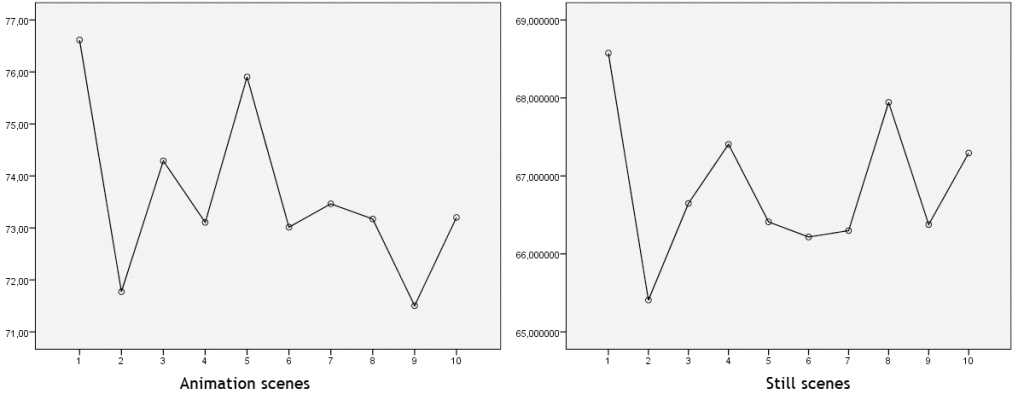
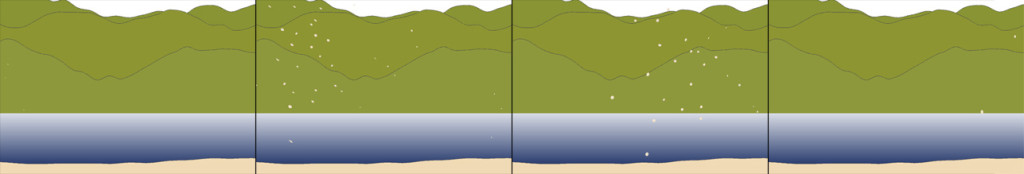
The variations between the scenes were not significant for the sound with still condition but they were at two points for the animated condition. You can view stills of the scenes below. There was a significant reduction in heart-rate of 4,8 between scenes 1 (mean 76,6) and 2 (mean 71,8). And a significant reduction in heart-rate between scenes 1 and 9 (mean 71, 5) of 5,1. This could suggest that more is happening to the participants in the animation condition and that animation has more potential for influencing the heart-rate of users.

allscenes
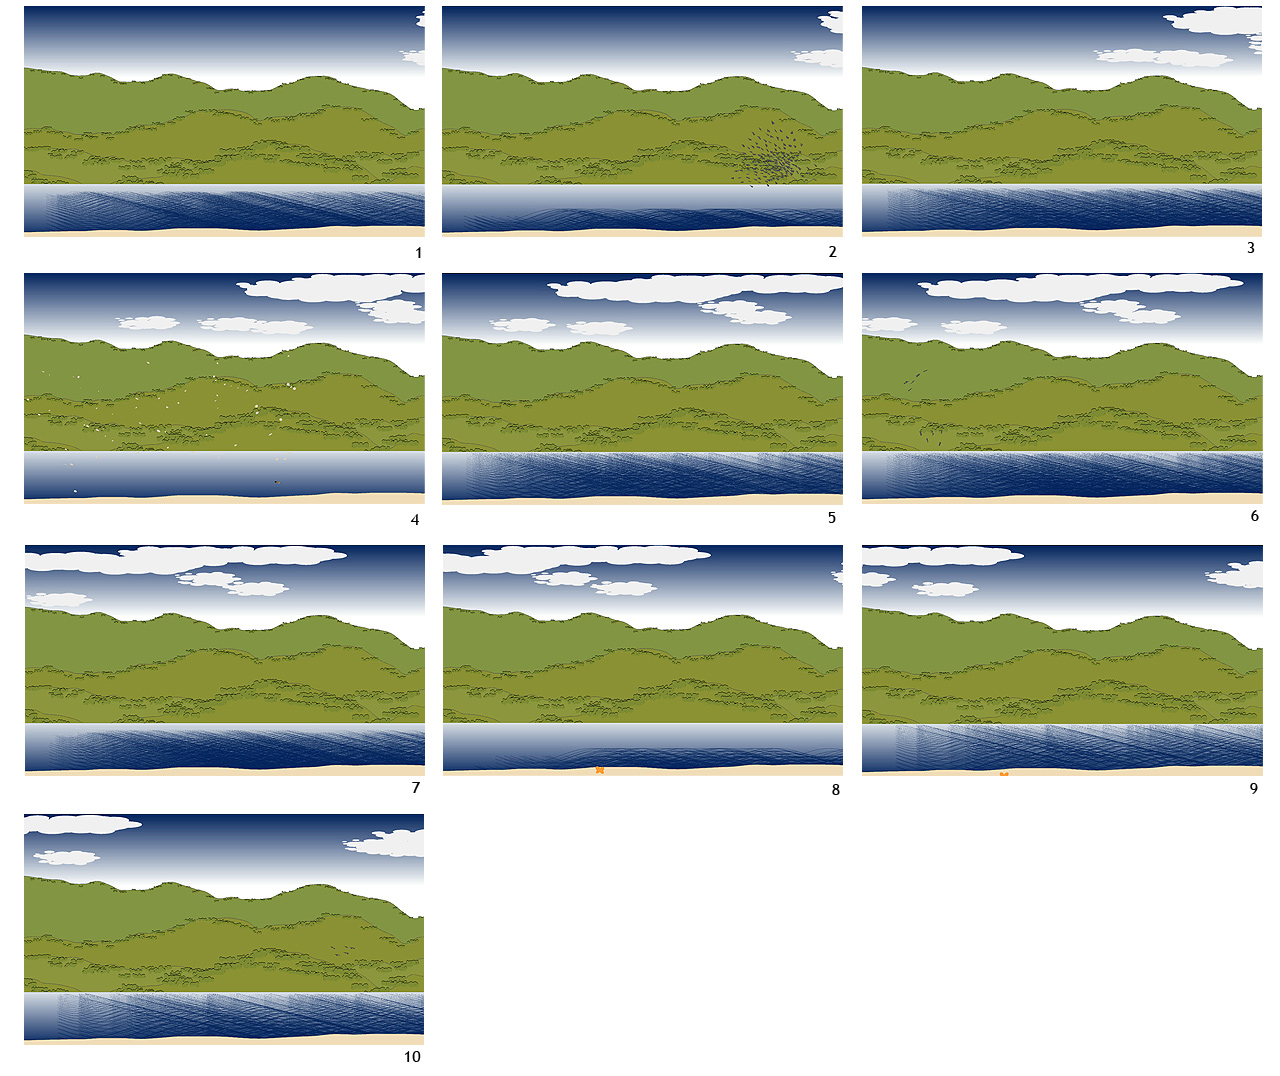
Stills from the 10 different scenes

Virtual View: experiment 3 setup

For the design of the third experiment I got advice from Petra van der Schaaf, environmental psychologist. The main research question for this experiment is: does animation have added value in the restorative effect of natural stimuli?
So far I’ve tested the stimuli in sets containing 6 or 12 slides. The sound didn’t have a direct relation to the images. In this experiment I want to take the stimulus a step further.
I’ve been working on a program to produce randomised computer generated landscapes which consists of hills with shrubs and water. On top of that different animated elements are projected: clouds, flocks of birds, bees, butterflies, blossom leaves and waves on the water.
All the elements move at their own speed and behave in an appropriate manner. By pressing certain keys I can make the elements appear and disappear from the screen. That way I constructed a scenario which I recorded on video. The stimulus isn’t responding to the heart-rate yet because I want to gain insight into the effects of animation. This way I’m sure the whole group gets the same input. Sound artist Julien Mier continued to work on the sounds and made a score to match the images and direction of movement on the screen.

Design

Due to lack of participants I had to reduce my conditions from 4 to 2, focussing on my own animation instead of also testing photo realistic versions. I worked with two groups: one group viewed the full video with accompanying sound. The other group got the full soundtrack but viewed only a still from the animation. That way I can test for the possible added effects of the animation element.

Subjective tension

The variables to be tested (the dependant variables) are:
Subjective feeling of tenseness. Participants score on the statement: “I feel tense.” This is measured on a 7 point likert scale going from not at all to the most tense ever. Beats per minute, inter beat interval (calculated from BPM), heart-coherence, heart-rate variability and Galvanic skin response. To measure the latter I used a separate device, the Mindtuner, which Malcolm from Heartlive kindly lend me. Two electrodes are placed around two fingers. A drawback is that the data is output in a separate file so I will have to do some data cleaning later to match the data with the events. But it will be nice to see how the skin conductivity behaves as this is a good indicator of stress.

Timeline

The experiment starts with the measurement for subjective tenseness. This is followed by a 5 minute baseline measurement where people are asked to relax while looking at a black screen. After reading instructions participants engage in a cognitive stress task. They have to do subtractions within a limited time span. The more correct answers they give the shorter the time they have to do the calculations. There are 27 calculations in the task. Depending on the speed of the participants this task takes around 2 minutes. They then have to fill in the subjective tenseness questionnaire again. Then they watch either the five minute animation with sound or the still with sound. The experiment finishes after they have filled in the tension questionnaire.

labAtBKKC

The lab is located in a separate room at the BKKC office. Participants are seated at a table at 200 cm from a TV screen. The image shown is 84,5 x 61,5 cm. The sound was play using an active noise cancellation headphone (Bose Quiet Comfort 25). We choose these headphones because the building is located close to railway and a lot of office noises penetrate into the lab.

Many thanks go to BKKC for their support with the promotion and organisation of the experiment. Special thanks go to Hans and Laetitia. Without their help this experiment would have been impossible.

Virtual View: programming animation

I’m still working hard on my animation. It’s going a bit slower then anticipated (what else is new) but I’m confident that I’ll have a nice, representative animation finished for the experiment. As an inventory, these are the elements that I want in the testing (and probably) final landscape: horizon with hills, sky, water body, shoreline, trees on the hills. And the animation elements: clouds, individual birds and flocks of birds, butterfly, bee, leafs blowing, ripples on the water. Forces I’m working with now are wind and gravity but I might include some more to make for example the water ripples move naturally.
So far I’ve build the look and feel of the landscape, tweaking it a little here and there as I go along. I’m very happy with the clouds. They consists of a lot of circles positioned using the Perlin noise algorithm. I’ve got big ones at the top and smaller ones a bit lower.

Some frames of clouds moving

I’ve brought down the number of hills visible as I think too many lines make a chaotic landscape which gives a restless feeling. The gradients for the sky and the water surface are the same, that just is more logical.
I’ve also included a shoreline to account for the appearance of the blossom leafs and butterflies.
I finally managed to give the blowing pink blossom leafs a natural look. It was quiet a challenge to make them rotate and move in the joyful and fascinating way leafs do.

Some frames of blossom animation

Next step will be to continue with the water ripple animation and the birds. Finally I will be working on the trees on the hills. All elements will be kept as simple as possible. The movement tell most of the story not the resemblance.

At this moment I can start animation elements at will. Which is nice for constructing a story. I can use it for the experiments with the prototype as well to test the effect of certain animating elements. But eventually the animations should start depending on heart-rate variables. That’s what I’ll have to find out when experimenting with the prototype.

Virtual View: developing animation

The past month I’ve been working on my landscape animation. By chance I discovered a great book by Daniel Shiffman called The nature of code. The book explains how to convert natural forces into code. I’m working through the book picking the forces and algorithms that suit my needs. So far the noise function in Processing has proven very useful. It allows for creating more natural variation (as opposed to the random function.) I use it in creating the landscape horizons and some forms of animation.

PerlinNoiseHills
Test for creating hills with Perlin noise

In a previous post I described how I calculated the colours used in a woodblock print from Hokusai. Since then I have discovered the colorlib library. A super fast library for creating palettes and gradients from existing pictures. You can sort colours and manipulate the palette using various methods. This means I can change my colours dynamically depending on user input.

Colorlib palette from Hokusai picture. Sorted on the colour green.

Apart from working through the book and creating basic animations I’m working on the look and feel of the landscape.

As I explained earlier this is based on the work of Hokusai. To my delight I discovered that a colleague is one of the few Dutch experts on Japanese woodblock printing, having received training in Japan. On top of that Jacomijn den Engelsen is also an artist whom I’ve admired for years. I met with her yesterday in her studio to learn more about this fascinating technique.

Jacomijn
Jacomijn demonstrating the Japanese woodblock printing technique.

The characteristic look of the pieces comes from the use of water based paint on wet rice paper. For every colour a separate woodblock is used. The typical black outlines are also printed from a separate block.

Screen print from animation. Colorlib gradient used for sky and water.

The prints have a very flat, 2D feel. That is what I like, it is a kind of primitive picture of a landscape. The view people will be seeing won’t be a 3D simulation of nature but an artistic representation, a work of art with healing properties.

I’m not a painter or draughtsman so I was very happy with the tips Jacomijn gave me on how to make the landscape more convincing while still keeping the ‘Japanese flatness’.

Virtual View: animation theory

The last weeks I’ve been working on designing and researching my third experiment. The next step will be to introduce animation and to study its effects. I was curious to see if there had already been research into the effect of different types of animation on stress reduction. Rather to my surprise I couldn’t find anything. It was hard to find any articles on animation what so ever…

My starting point was neurocinematics and psychocinematics. New fields of research on cognitive function during movie viewing. Attention is an important subject here. Then I found a journal dedicated to animation and found some very interesting information on the nature of animation and links between Eastern philosophy and religion and Japanese anime animation. That was very interesting for me. This way I can combine the visuals of Virtual View with Zen mediation and Buddhism, which I have been practising for almost 20 years. I realize now that my forests experiences on which Virtual View are based are rooted in my meditation practice. This is also what I want to convey with this installation.

In the next part I’ll summarise my findings and explain how I will test them in the animations I will make for my next experiment.

Even though the book chapter by Carroll and Seeley (draft version) is about Hollywood cinema it shed light on some aspects of my research. Because I want the users of Virtual View to have a relaxing and restorative experience attention is very important. How do I keep my users softly fascinated? Hollywood films capture attention by giving the viewers only just enough information using stylistic conventions. They also use variable framing: different techniques like camera movements and zooms to direct our attention. The theatre design with the big screen and darkened surroundings helps to minimize cognitive load. My interpretation of these thoughts is that a certain amount of abstraction can heighten attention. As can “camera” movement. These are things to play with. The actual installation should be set up to avoid distractions.

What interested me in the article by Torre is that animation can be expressive of itself. Motion can be transferred from one object to another to create surprising results and again, capture attention. As animation can be layered movement and transformation will have a cumulative effect and make anything possible in the way the impossible is possible in dreams. It will be nice to experiment with non-realistic events in the Virtual View animation.

The articles by Chow were a real revelation to me. His ideas of types of liveliness and holistic animacy fit perfectly with what I had in mind with Virtual View and what should be happening on the screen. For him primary liveliness is goal oriented and can been seen in for example Disney animations where a character causes all kinds of events. Secondary liveliness is unintentional and emergent. The sort of movement that can be seen in nature: the swarming of birds, waving of trees but also growth and shape changing. Where primary liveliness focuses our attention, secondary liveliness dilutes it, capturing our attention in a soft way. For Chow this wonder is linked to the ideas of Daoism and the concept of kami in Shintoism. They both promote respect for and connection with nature. He explains liveliness in computer graphics. Techniques like morphing, looping and Boids are good representatives of secondary liveliness. The eastern animation style called anime is also has good examples of this kind of liveliness. He shows some very nice examples of computer animation:


The Nintendo DS game Electroplankton

Chow also refers to old, Chinese maps of which the design is of the landscape elements was tightly regulated by rules. Rules are there to be bend so artists turned the maps into multi-perspective narratives. The maps are just beautiful, clear and mysterious at the same time.

Needham, J. (1962[1959]) from Science and Civilisation in China
Chow goes on to link animation with interactivity by looking at some pre-cinematic technologies. One of them is the handscroll, an ancient form of Chinese painting of which Along the River During the Qingming Festival is an example. When someone looks at a handscroll painting they interact with the picture emulating what we now call a camera pan. This way they include both time and space into the painting. I’m now considering capturing head movements as added interactivity to Virtual View. The animation will pan in the direction the head moves. This way people can expand they view and have richer, more varied experience.


The installation Along the River During the Qingming Festival

The last inspiration comes from an in depth article by Bigelow on the Japanese animation artist Miyazaki. She states that Miyazaki creates an aesthetic experience “… that invokes a Zen-Shinto pre-reflective consciousness of the inter- relation of the human with the tool and nature. It is a way of perceiving change in stillness…”. Bigelow sees a parallel between the state of mind of the artist and the state of selfless emptiness as it is described in Zen Buddhism and Shinto. It can create a state of wonder because this empty mind precedes concepts and naming. Miyazaki also expresses in his films the idea of the Shinto notion of kami in which all things have life spirit. This way of looking at reality makes way for a dimension of mystery and wonder to be discovered in nature.

Japanese anime is rooted in the art of woodblock printing of which I am a great fan. Miyazaki’s work is not photo-realistic but tries to capture the essence of reality that expresses interconnectedness. These things can, in his view, be lost in virtual reality, as it is often very technical and an industrialised method.

In my Virtual View animation I would like to evoke a sense of wonder by offering a non-photorealistic view that is lively in a way that reminds of real nature. I don’t want to replicate nature the way it is done in 3D virtual reality. It always seems dead to me, after reading these articles I understand why. The aesthetics will come from eastern art, which I love. The view will be a lively tableau with different kinds of computed animations which have there origin in natural phenomena. I will introduces panning to add extra space and “time” to the animation and to be able to add more, conscious interactivity in the prototyping stage. I will use these starting points to create a video of the animation which I will test in my next experiment. A description of that will appear soon on this blog.

Sources

Noel Carroll & William P Seeley. (2013) Cognitivism, Psychology, and Neuroscience,: Movies as Attentional Engines. Psychocinematics: The Aesthetic Science of Movies (draft copy).
Torre, D. Cognitive Animation Theory: A Process-Based Reading of Animation and Human Cognition. Animation: an interdisciplinary journal 9(1) p. 47-64
Chow, Kenny Ka-nin. The Spiritual—Functional Loop: Animation Redefined in the Digital Age Animation, March 2009; vol. 4, 1: pp. 77-89.
Bigelow, S. J. Technologies of Perception: Miyazaki in Theory and Practice. Animation March 2009 vol. 4 no. 1 55-75.
Chow, K. K. Toward Holistic Animacy: Digital Animated Phenomena echoing East Asian Thoughts. Animation July 2012 vol. 7 no. 2 175-187.
Shimamura, A. P. (2013). Presenting and analyzing movie stimuli for psychocinematic research. Tutorials in Quantitative Methods in Psychology, 9, 1-5

Virtual View: colour pallet

I’ve written a little program to create a colour pallet for my landscapes. At the moment I’m studying articles on animation. Again they lead me to Japanese and Chinese drawing and block printing. I wasn’t planning to go there but there is such a strong link between my views on nature and eastern religious and philosophical traditions that it is just the most logical and pleasant route to take for me. I’ll dive deeper into this is my next post.

Below you see a scan of a Japanese block printed landscape by Hokusai. I like the colour pallet and I was wondering if I could find and easy way to just use the colours in my animation. After some programming (it’s been a while…) I’ve managed to extract the unique colours from the picture and display them. There are over 114000 colours in this picture! I’ve reproduced the original picture on top. It is so nice to see how just plotting the colours already creates a something that resembles an abstract landscape.

hokusaiPallet

This piece of code enables me to extract all the colours from any digital image and use that as a basis for my computer graphics.

Information literacy

While designing experiment number three I bumped into the complexity of doing proper research. I realised I lacked some information literacy skills. Luckily the Open University (where I study psychology) offers free master classes. Last week one started on information literacy for researchers.
This has been very helpful for me to get a grip on the research process. Eye-openers for me were ways to clarify the research questions/tasks. All though I did have quite a clear view of what I want to research there are quite a few issues that need clarification. I’ve used a mind map to create an overview of the main and sub search questions at hand.

mindMapExperiment3

From that I’ve formulated clear search questions to streamline my search.

I also made a log of the key words I searched on and the results they generated. From that I can go on to studying and evaluating the relevant articles. I’ve got a template to fill in items like: Type of publication, research goal, theoretical focus and method. That way I get a nice overview of the articles I’ve studied.

I’ve been using Mendeley to collect my articles. You can organise them and mark important sections for easy summary. All content is stored in the cloud so I can read and highlight on any device.

mendeley

But it becomes more and more clear to me why scientific research is so time consuming…

Virtual View: results experiment 2

The analysis of the second experiment has taken a long time. At first there appeared to be no significant results on any of the variables, except on the heart-rate during the cognitive stress task. So I consulted different people with a degree and research experience and asked for help. I’ve really learned a lot from them. They all have different approaches and ways of working so I’ve picked out all the good tips and insights. My thanks go to Sarah, Malcolm and Marie. The latter is a researcher at Tilburg University, her knowledge of statistics dazzled me. She is the one who recommended a different analyses which has yielded more significant results.

Research questions

My main questions for this experiment were: Which type of stimulus results in the most stress reduction and relaxation? And which stimulus produces the highest heart-coherence? As I want the values on that variable do drive my landscape animation.
To test these questions I used the following dependant variables: BPM, heart coherence,
later I introduced heart-rate variability calculated from inter-beat interval, self reported stress and self reported relaxation. These were measured during the baseline measurement, the cognitive stress tasks and the stimulus sets.
The independent variables are: stimulus set 1 with 12 landscape photographs and synthetic nature sounds, stimulus set 2 with more abstract landscapes styled by me with the synthetic natures sounds in the background. Stimulus set 3 consisted of 12 photographs of kitchen utensils and a soundtrack of someone preparing a salad. The expected direction of the variables will be explained below.

Analyses

After struggling for some time with the non-significance of the variables in the different sets I discovered that the randomisation of the sets hadn’t been ideal. There were 33 participants who viewed the sets in 6 different orders. On top of that the group size per order was different. Some groups were only 4 participants, others 10. This is something I’ll have to take into account in my next experiment.
I used a repeated measures analyses. On my first, non-significant results, I used my baseline measurement as a covariate. Marie said that wasn’t the way to go. So I used just repeated measures where the baseline is just the first measurement, no covariates. And I did post hoc analysis (Bonferroni) to see the differences between the set results.
This is an overview of the results:
Results overview
Sarah made this clear lay-out of the research results compared to the expected results.
As you can see from the blue results the subjective stress measurements are significant compared to the baseline for all three stress tasks. For the first stress task (note this task isn’t connected to set 1, it is just the first task after the baseline measurement) the difference in heart-rate is significant during the stress task. There is also significant difference in HR during the landscape set. The kitchen utensil set heart-rate is also significant. Even though the heart-coherence is has the right direction non of the changes are significant. There are also no significant differences between the subjective relaxation questionnaires.

On Sarah’s recommendation I also looked at correlation between all the variables. That is very interesting as it reveals relationships between the variables. As the subjective relaxation questionnaire didn’t show any significant results I was curious to see how it correlates with the stress questionnaire. There should be a significant negative correlation between the two. And there is, it is especially strong for the baseline stress measurement and all relaxation measurements. On the other hand there was no correlation between subjective relaxation and heart-rate, a lowering of this value may be considered an indication of relaxation. All in all the relaxation questionnaire doesn’t give convincing results. There was a very strong correlation between heart-rate and heart-rate variability. In fact too strong, as Sarah pointed out they measure the same thing so it has no use including this variable in the results.

First set

As the stress stimulus was strongest the first time (view below) Marie advised me to do an analyses on the first set that was shown after the first stress task, independent of what kind of stimulus set it was. This was the distribution: set 1:    shown 11 times; set 2: 14; set 3: 8. The results from this analyses completely matched the other results. Heart-rate and heart-rate variability are significant (this is of course an average of all three sets shown), heart coherence and self reported relaxation were not. There was no interaction effect between the set shown and either the heart-rate or heart-rate variability which suggest that the order has no effects on the results.

Graphs

Stimulus overview

I made some manual graphs to see the effects of the stimuli on heart-rate and heart coherence side by side. There is no significant difference between the pictures in the three sets. For me it is still nice to see the difference between the pictures. The graph is done manually in Photoshop.

Stimuli used

HRV

After getting advice from Malcolm  about the results he suggested I calculate heart-rate variability from the inter-beat interval values that I’d logged. Heart-rate variability is known to correlate well with stress (negative) and relaxation (positive). So that’s valuable information to add to the results.
I wrote a script in Processing to calculate and visualise the HRV for the whole experiment divided in a 5 second windows. The white line is the baseline measurement, the red lines are the stress inductions and the green lines are the audiovisual stimuli. You can tell from the image that the stress induction has some effect.

HRV results
Looking at my correlation table however there is only a significant negative correlation between the baseline subjective stress measurement and the HRV. Neither the other stress measurements nor the subjective relaxation measurements show any correlation.
It is hard to tell from the image but the photo realistic landscape set has a significant difference from the baseline measurement. The third set is almost significant (p = .054).

Conclusions

The first conclusion should be that the differences between the stimuli in the sets are small. There are significant* differences in average heart-rate between the sets (68,26 (baseline); 66.46* (set 1); 66.75 (set 2); 66.32* (set 3)). But the differences are really small. There is reduction in all the sets. Set 3, the kitchen utensils has the lowest average.  The set isn’t very stimulating which might explain the low heart-rate. This conclusion is also backed by the fact that the results from using only the first set shown are comparable to when working with the individual sets.
Heart coherence, which I want to use for driving the animation and to trigger the interaction with the installation showed that the styled landscapes with sounds had the highest heart coherence average but the results were not significant.  It does not seem a good measure for pure relaxation. Heart coherence is a difficult term but this description gives a good indication of the different aspects of this state: In summary, psychophysiological coherence is a distinctive mode of function driven by sustained, modulated positive emotions. At the psychological level, the term “coherence” is used to denote the high degree of order, harmony, and stability in mental and emotional processes that is experienced during this mode. (From The Coherent Heart p. 12, Mccraty, Rollin Ph et all, Institute of HeartMath). On page 17 of that document it states that: “In healthy individuals as heart rate increases, HRV decreases, and vice versa.” As HRV and coherence are closely linked the same is true for heart coherence. Even though heart coherence is much broader than relaxation is also encompasses activation of the parasympathic nervous system which is also a marker for relaxation. Important in heart coherence is the inclusion of positive emotions. This is what I try to evoke by using landscapes based on generally preferred landscapes.
The Virtual View installation should provide a relaxing distraction for people in care environments. Cognitive states that relate to this goal are soft fascination and a sense of being away as introduced in the Attention restoration theory (ART) by Kaplan and Kaplan. I’m guessing now that heart coherence might correlate with those cognitive states. This is something I will explore in the next experiment.

The stress task was perceived as stressful judging from the subjective reports. These findings are partly backed by the physiological data. Only the heart-rate of the first stress task differs significantly from the baseline. Our goal by introducing a stress task was to create bigger differences in heart-rate. For that to be successful the stress task should really produce stress. Although people reported feeling stressed we can’t measure it three times in a row. So for the next experiment I’ll work with 3 groups who will all get only one stress stimulus and one landscape stimulus.

All in all this experiment doesn’t prove that my styled landscapes with synthetic nature sounds create the most relaxation and heart-coherence but the results neither prove that they don’t. So for the next experiment I’ll continue with the styled landscapes and introduce animation.

Virtual View: conducting experiment two

Our ideal for the execution of the second experiment was to have 60 participants of 40 years and older. There would be two labs where the experiment would be held in alternating rooms over 3 days. The rooms would be in a quite part of the school as we had quite a lot of disturbance during the first experiment.

The first setback was the location. It wasn’t possible to have two classrooms for three days at the same time. There weren’t any rooms available in a quiet part of the school. Eventually there was no other choice then to use a room in the middle of the busy documentation centre and spread the experiments out over 5 days. The room was a kind of aquarium, it was very light and you could see people walking around through the glass walls. During the test there was disturbance from talking and students opening the lab door by mistake. So far from ideal.

But my main disappoint was with the sample. Only one day before the start of the experiment the students notified me that they had managed to only get 20 participants instead of the 60 we had agreed upon. We were mostly depending on the teachers for participation but it was the period of the preliminaries and they were very busy. Also the trial would now take 40 minutes instead of the 20 to 30 minutes the first experiment took. Had I known earlier I could have taken steps and come up with a suitable solution.
As it was I had to improvise. I had to let go of the control group and had to broaden the age range. In the end 6 students of below 30 years old took part. I asked around in my own network and managed to recruit 10 people in the right age group. In the end we tested 40 people, all of whom were exposed to the stress stimulus.

Unfortunately not all the results were valid and useful. Some data was lost due to technical problems. Also quite a number of people made mistakes with filling in the questionnaires. We now had two questionnaires, one for self reported stress and one for self reported relaxation. The stress questionnaire contained one question in the positive direction (I feel everything is under control) and two negative items (I feel irritated, I feel tense and nervous). Both had to be reported on a 10 point scale.stressQuestionnaireApparently this was confusing for some people and even thought notes were taken it wasn’t always possible to reconstruct the correct answer. In the next experiment will put also some text below the numbers to indicate the value.
There were also two very extreme results (outliers), they can’t be included in the data set as they would mess up the averages too much. So I ended up will 33 data sets I could use for my analyses.

But first the data had to be sorted and structured. It took me quite some time to streamline the copious EventIDE output into a useful SPSS dataset.

The baseline measurement included self reported stress (pink), heart-rate (orange) and heart-coherence (red) and self reported relaxation (green). baselineOutput
The three answers from all the questionnaires had to be combined into one value and checked for internal validity in SPSS.

It’s nice to take a look at a part of the results from the cognitive stress task:
cognitiveTask
From the output you can see exactly what the sums were, how much time it took to make them, what the answer was and if the given answer was correct or not. I didn’t use this data but it would be nice to see if for example participants with more faults have higher heart-rates. Heart-rate (orange) and heart-coherence (red) are again below the results.

Before each stimulus set there was the stress questionnaire and after each set the relaxation questionnaire. The output for each set, which consisted of 12 pictures with sound is laid out as follows:
Picture count | set number | image id | image name | inter beat interval | BPM | heart-coherence
setOutput
Each picture was shown for 20 seconds and the heart data was logged around four times per second. The output for one picture looks like this: 60.6|60.5|60.4|60.9|61.2|61.5|61.7|61.8|61.9|61.9|61.9|61.9|61.9|61.9|61.8|62.6|63.1|63.5|63.7|63.5|63.3|63.2|63.2|63.1|63.7|63.8|63.9|63.4|63.1|62.9|62.7|63.1|63.5|63.6|63.6|63.7|63.7|63.8|63.8|63.8|63.4|63.2|62.9|62.8|62.9|62.9|62.9|62.9|62.6|62.2|62.1|61.8|61.5|61.3|61.2|61.1|61.1|61.0|60.9|60.8|61.1|61.3|61.4|61.5|61.6|61.6|61.7|61.7|61.7|61.5|61.3|61.3|61.2|61.2|61.0|60.9|60.8|61.0|61.1|61.2|61.2|61.2|61.3|61.3|61.4|61.4|61.0|
This yields an average of 62.1 which is the output I used. But it is good to have all this data for each individual image. All the image averages had to be combined in a set average so I could easily analyse the differences between all three sets. I’m still analysing the data. More on that in my next post.

Virtual View: design of experiment two

After conducting and analysing the first experiment some points of improvement emerged.

  • The differences in heart-rate between the sets weren’t significant so we want to create more extremes in heart-rate.
  • One group will get a heart-rate enhancing trigger and there will be a control group that won’t.
  • There was evidence of interaction with age for some of the variables so we want a more homogeneous age group to work with.
  • The experiment should be simplified, less sets and keep sounds the same for the landscapes sets. The duration of each stimulus was rather short so we want to try to double the amount of pictures in each set.
  • The control set should be neutral instead of negative.

It was clear that we want to introduce stress into the experiment. The target group are patients who visit hospitals. They are under stress a lot of the time. So we have to create a stress stimulus. Together with the students and a teacher from Avans Hogeschool we looked into some of the known possibilities for inducing stress. Our idea was to simulate a hospital through minor medical treatments. But we realized this will probably not work with our sample. They will be teachers with a background in nursing so taking blood pressure won’t upset them. I also discussed some options with Malcolm and Sarah. Showing parts of horror movies we considered to be too subjective. The best option is physical stress in the form of electro shock or ice-water. But this is out of our league. We don’t have the knowledge or experience to conduct an experiment like that.

Finally I settled for cognitive stress task in the form of calculations. As the stress task had to be repeated we needed a stimulus that would remain a challenge and induce some stress. Cognitive tasks have that ability. To keep it challenging there should be different levels to also keep it interesting for people whore a good at doing calculations. I made a little design.

cognitive Task Design

I had no idea how this design could be implemented in EventIDE. So I send my sketch to Ilia who programmed a nice interface. On the one hand the subtractions would get more difficult if your answers are correct. On top of that the allotted time will decrease if there are three correct answers in a row.

cognitive Task
The design is a 2×3 factorial with repeated measures. There will be three landscapes/objects with sounds and each of them will be experienced either with or without a stress stimulus preceding them.

Factor design

The flow of the experiment is as follows:
Design Experiment 2
Depending on how long it would take for the participants to complete the questionnaires the duration of the entire experiment will be around 30 minutes.

For me it was kind of hard to include the different questionnaires. We wanted to check experienced relaxation as we did in the first experiment. But we also wanted to know how much stress participants had experienced during the stress task. As these are opposite experiences I found it hard to find a place for both in the flow of the experiment. I finally settled for checking for self-reported stress right after the cognitive task and reporting relaxation after the landscape stimuli.

I would have loved to measure physiological stress data. Apart from heart-rate and heart-coherence there was no objective data. I discussed it with Malcolm. He kindly offered to lend me some of his equipment but we realized we just didn’t have enough time to implement it properly. So for now I just have to do with the heart-rate and self-reporting.

The dependent variables in this experiment are:
Heart-rate (beats per minute & inter beat interval)
Heart-coherence
Self-reported stress
Self-reported relaxation
The independent variables are:
Photo realistic landscapes & synthetic nature sounds
Styled landscapes & synthetic nature sounds
Kitchen utensils & kitchen sounds
Age and gender

The sample will consists of 30 + 30 participants older then 40 years without heart problems or heart medication.

Finally I could work on my own creations. This was the time for me to test some of my first sketches of the Virtual View landscapes. They are a combination of computer graphics made in Photoshop and computer generated images made in Processing. I combined them into bitmaps. As we wanted participants to be exposed longer to the stimuli we doubled the amount of pictures in each set from 6 to 12. The inspiration for the landscapes came from our literature study and the results of the first experiment. As an artist I wanted to see what I can leave out and still have a relaxing effect. I also experimented with different techniques to create the image elements.
styled landscape
The photo realistic images were chosen to resemble the styled image and have the same simple layout. The idea was to see it there would be a difference in relaxation and stress reduction effect between the computer graphics and the photographs.

Photo realistic landscape

Our initial idea for the neutral images was again to use interiors. We thought of general school areas. But as we were approaching the end of the year the teachers would be pretty highly strung and seeing pictures of the school might not be neutral for some. So we decided to use kitchen utensils. For the sound we used a recording of someone preparing salad.
The sounds to accompany the landscapes were produced and composed by Julien Mier.  For us this was also the first sketch of what Virtual View could sound like. Julien made some nice synthetic birds and bees. We worked towards a piece that was a mix of background noise, silence and unexpected animal noises. The sound was timed to the transitions between the images in the experiment. So every 20 seconds a new piece of sound was started with different accents. We used the same soundtrack for both landscape sets.