Introduction
Magic Tea (MT) is an interactive art installation with which users can prepare and drink tea (Fig.1). It aims to invite self-transcendent experiences (STE) during this activity.
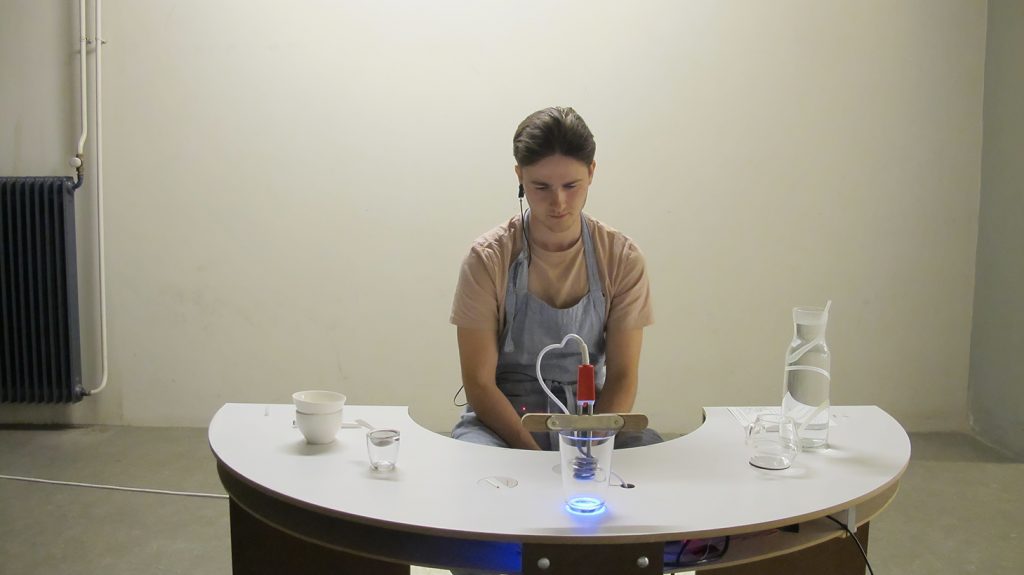
The installation uses tangible connected objects and the users own biometric data to blur the boundaries between the user and the objects used in the installation. The activity itself has been turned into a ritual by manipulating tempo, aesthetics and transparency of all the steps of the activity. The goal is to create a shift in the users’ perception of the world around them and how they are connected to it.
The test of the effectiveness of the MT prototype version 2 is divided into two stages: 1. Test its usability without an STE measure. 2. Test for the occurrence of STE using validated measures. This post describes the usability test and its results. The focus of the test is on the usability of the system, it’s manual and the awareness of the stimuli. The main goal of the test is to find out if the current design and interaction has the right balance between challenge and user-friendliness. A lack of usability may hinder the occurrence of an STE.
Method
After filling in the consent form participants are asked to make tea with MT using the manual. They are instructed to: put their phone in a signal-blocking purse, take off their shoes, put on the wearable, attach the ear clip (for measuring heart rate) and find a comfortable position using the stool or cushion. They are then invited to read the manual and start the process without further instructions. If they get stuck or if a dangerous situation occurs the experiment leader will intervene. The following methods are used to gain insight into the understandability and comfort of use of the installation.
- Think aloud. Throughout the activity, users are invited to express their thoughts and associations. The experiment leader will not reply or start a conversation. The main purpose is to gain insight into what goes on in the users head. The experiment leader will take notes.
- Checklist observation. During the process the participants will be observed during all eight steps of the intervention: intentions writing, entrainment, water tapping, water boiling, rinsing tea, steeping tea, drinking tea, writing reflection and also the reading of the manual. The focus will be on movements and expressions which indicate understanding and comfort or lack thereof. The experiment leader will take notes.
- Semi-structured interview. In the interview users are asked to 1. indicate if they noticed the stimuli during the different phases of the experience: intention writing, entrainment, water tapping, water boiling, rinsing tea, steeping tea drinking tea and reflection writing and how this affected them emotionally. 2. Give an account of their experience and comment on the design. The interview will be recorded with the users’ permission.
- System Usability Scale (SUS) (Brooke, 1996). This is a ten-item questionnaire using a 5-point Likert scale from 1: Strongly disagree to 5: Strongly agree. It is used to test various kinds of interactive systems. Although Magic Tea is not designed to be efficient, it should not be so hard to use that it would make users feel anxious or insecure because this might be an obstacle to experiencing STE.
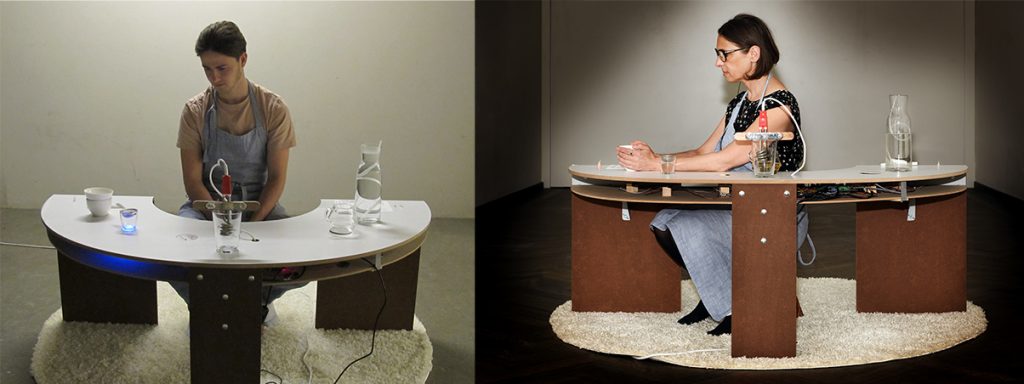
In total 7 participants (M = 4, F = 3, other = 0) took part in the test. The mean age was 38, with a minimum of 22, and a maximum of 56. The test was spread over 3 days and two locations (Fig. 2).
Results
Observation, think aloud and interview
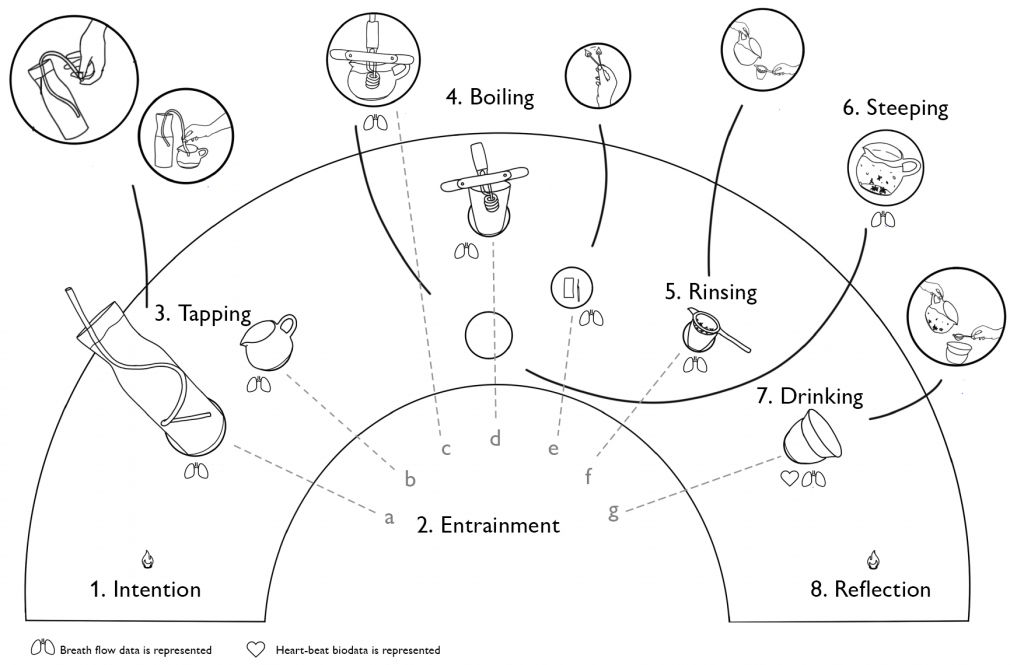
The Magic Tea ritual consists of eight main steps (Fig 3). The following table lists these steps, the main insights and possible improvements that emerged from user observations, their thoughts and the interviews. For every stimulus, it states how many out of the persons asked noticed it (e.g. 4/6 means, 6 participants were asked about this stimulus during the interview and 4 have noticed it. The stimuli have different aspects e.g. sound may have a rhythm, may change in volume and represent a sound from nature. It will be stated which aspects were noted by the participants.
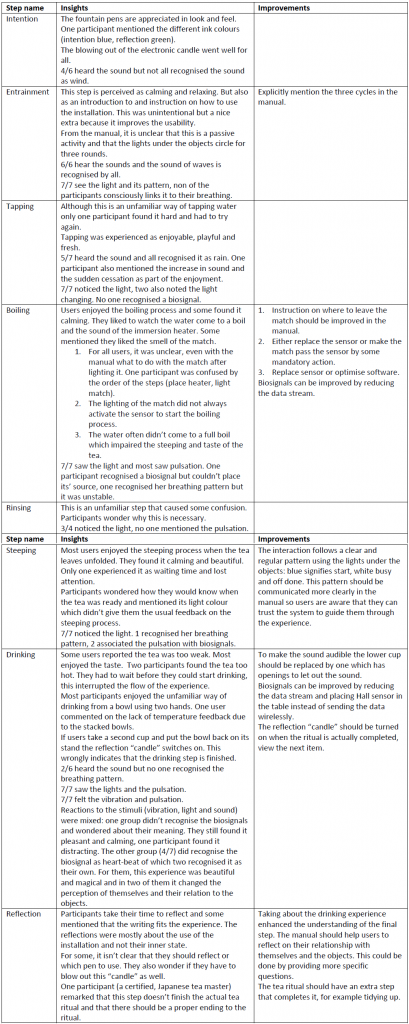
observation, think aloud and interview methods
General remarks
Participants found the installation pleasant, calming and friendly to use. They enjoyed the “digitalisation” and the novel tea-drinking process. Positive comments were made on the colour and transparency of the materials used. They enhanced the calming effect of the experience. Participants also enjoyed the diffuse lights. One participant associated the blue light with a laboratory and less with tea drinking.
The interaction was perceived a pleasant, clear and for the most part intuitive. The more the ritual advanced the better user understood the pattern and the trust in the system grew. They understood that the system would guide them but also appreciated the granted autonomy. The system waits for the user to start the next step. They determine the pace of the ritual.
Apart from the omissions and additions mentioned above the manual caused stress in some users. The long text and the detailed instructions felt taxing. The layout which split the text and the images were hard to use. But overall participants did find it helpful and clear. The manual should be used to build trust in the system, explain steps that are less know and be used only as a backup when users fail to understand the interaction signals.
Not all the stimuli are noticed and interpreted correctly with first-time use. 3/7 users pointed out that it is a layered experience that people would like to come back to and discover more each time they use it.
System Usability Scale (SUS)
This scale was included to gain insight into the user-friendliness of MT and its learning curve. A quantitative measure provides another way to learn about how the system is used and perceived. As a ritual MT wasn’t designed for ease of use or efficiency. It should be challenging enough to keep users attentive and engaged. However, if the system should be too cumbersome or stressful to use this might impair the chances for users to experience STE. Therefore the hypothesis was that the score wouldn’t be very high but also not poor. The score was calculated using the standard method (Thomas, 2015).
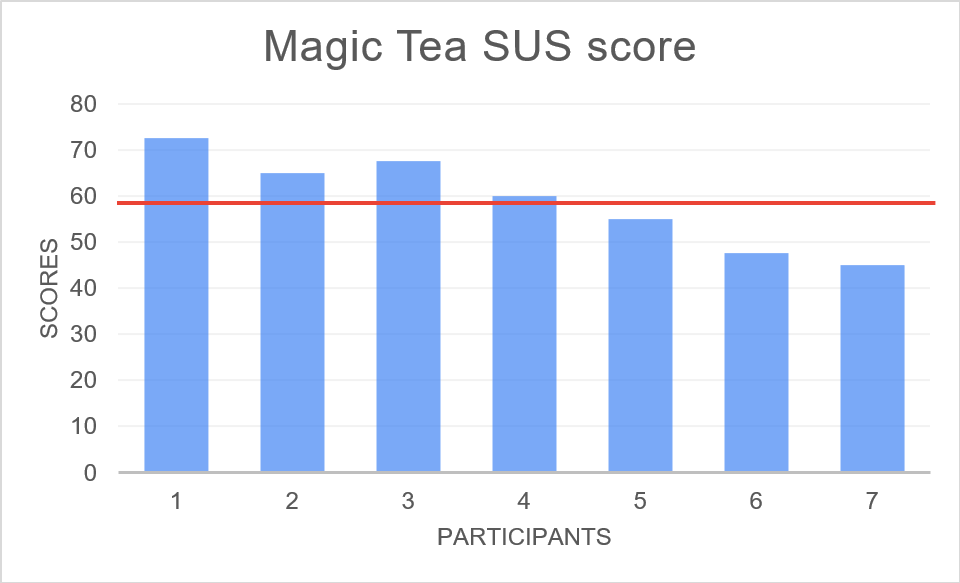
The mean SUS was 59 which is rated as okay (Brook, 2013). Scores below 51 indicate a poor system, 73 and above indicate good and excellent (Ibid.). These scores confirm the hypothesis: the usability of the system falls between good and poor. This suggests the right amount of user-friendliness.
Question 7 ‘I would imagine that most people would learn to use MT very quickly.’ scored highest. This suggests good learnability. Question 8 ‘I found MT very cumbersome to use.’ scored lowest. This indicates that even though the tea preparation is unusual participants didn’t find it cumbersome.
There are interesting differences between two group characteristics: gender and age. Male participants scored an average of 65 while the female participants only scored 51. The same pattern can be seen with regard to age. Participants aged under 50 scored 63, those above scored 50. But there is an overlap between gender and the age: mean age for the men is 31 against 47 for the women. From this small sample, it is hard to tell if the differences in scores are related to age or gender. However the three youngest participants, all male score 68. One older male scores 55 which is more in line with the female scores. But the sample is too small to draw any conclusions from the data.
Conclusion
In general, the seven participants found using MT a novel, pleasant and calming experience. The interaction was mostly clear and the design was helpful to the experience. This is confirmed by the SUS which was sufficient. Improvements to the electronics and measurements will improve the quality of the experience. The more unusual steps in the ritual will benefit from clearer instructions. An improved manual that will instil trust in the system from the start will help users surrender to the system and stay more focused on the actions.
References
Brooke, J. (1996). SUS—a quick and dirty usability scale. Usability Eval. Ind. 189(194), 4–7.
Brooke, J. (2013). SUS – a retrospective. Journal of Usability Studies, 8(2), 29-40.
Thomas, N. (2015). How To Use The System Usability Scale (SUS) To Evaluate The Usability Of Your Website. Usability Geek. https://usabilitygeek.com/how-to-use-the-system-usability-scale-sus-to-evaluate-the-usability-of-your-website/ Accessed 7-8-2021.