Virtual View: results experiment one

In this post I want to give an overview of the results of the first and I will spare you the heavy statistic speak. So don’t expect a scientific article. The data is there and I may write a proper article one day but it isn’t appropriate for this blog.

Together with Hein from the Open University I looked at the data from the first experiment. This is an exploratory experiment so we’re looking for trends and directions to take with us to the next step.
The students did a splendid job organizing the dataset. For each participant there was basic demographic data (gender and age) means and combined means for the perceived relaxation questions, the separate images and images combined in sets. For each set there are means for: beats per minute (BPM), the inter beat interval (IBI) and heart-coherence.
To make sure our self constructed questionnaire was valid I did a scale reliability test. All the sets had good reliability for all 5 questionnaires. This just means that there is an internal consistency between the questions. The questionnaire it self isn’t validated for measuring relaxation. We just asked the three questions.

We did 4 analyses on the four variables: perceived relaxation (measured with the questionnaires), BPM, IBI and heart-coherence.
The stimuli sets were {sound}:
1. Preferred landscape with water element {running water @ 48 Db}
2. Preferred landscape in autumn {repetitive bird calls @ 47 Db}
3. Preferred landscape as abstract painting {melodious birdsong @ 56 Db}
4. Neutral hospital interiors {neutral hospital sounds @ 48 Db}
5. Landscape with deflecting views {running water and melodious birdsong @ 43 Db}

Self-reported relaxation

self-reported relaxation
self-reported relaxation, sets 1 to 5. Green is females, blue is males

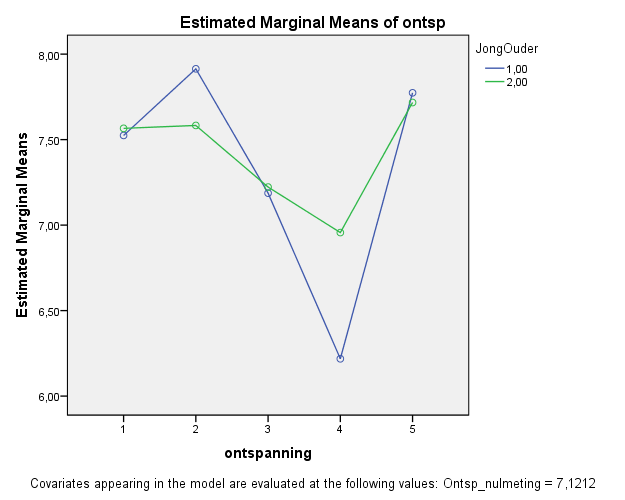
The three questions we asked after the baseline measurement and after every stimulus set were: I feel at ease, I feel relaxed, I feel joyful and happy. Reported on a scale of 1 to 10. The three questions were merged into a relaxation scale. The hypotheses was that the overall relaxation scale would be lower for the hospital interior set (d) than for all of the landscape sets.
There was a significant effect for relaxation. As you can see from the graph set number four (hospital interiors) shows a distinct decrease of the sense of relaxation. Although the abstract paintings also score lower, this trend is mainly caused by the dip in relaxation scores on the hospital set, this confirms our hypotheses.

There was also something going on with the interaction between age and relaxation. To gain more insight into what’s happening with the age effect I looked at the data and noticed there are two clear groups: 25 years old and younger and above 39 years. The groups are about the same size (young 15, older 18). There were no participants of the age between 25 and 39 years. To test for the significance of the relaxation for the two groups I ran a test that showed that for the young participants the relaxation effect isn’t significant but for the older participants it is.

relaxation divided by age group
relaxation divided by age group. Blue is older.

Heart-rate
For the heart-rate we used two measures based on the same data: beats per minute (BPM) and inter beat interval (IBI). So it doesn’t make a difference which data analyses I discus here. The hypotheses was that the BPM would be higher for the hospital interior set (d) than for all of the landscape sets.
There we no significant differences between the sets. Our hypotheses has to be rejected.

heart-rate for men and women
heart-rate for men (blue) and women (green)

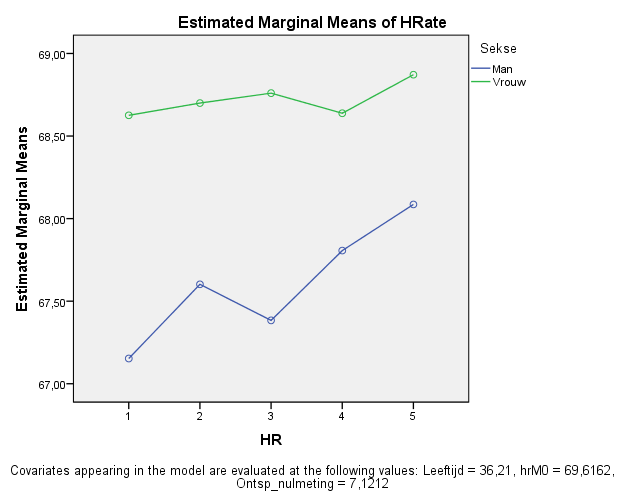
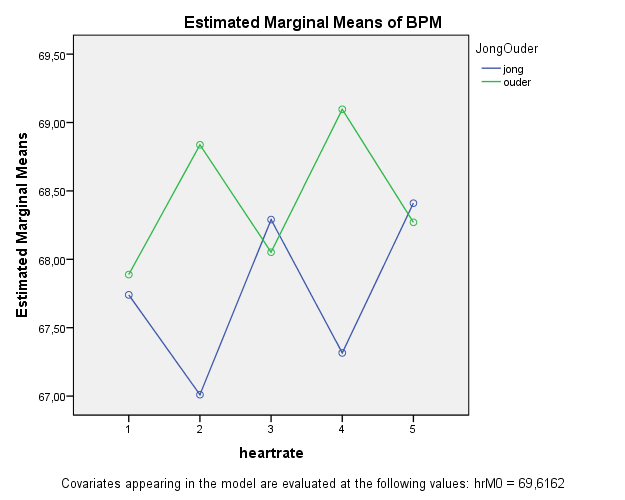
But there is again something going on with age, this time in relation to heart-rate. Looking at the graph below it is clear that the heart-rate in reaction to the landscapes and sounds is at odds for set two and set four. The older and younger people react quite differently.

Beats per minute for two age groups
Beats per minute for two age groups. Younger is blue.

Heart coherence
The hypotheses for heart coherence was that the coherence level would be lower for the hospital interior set (4) than for all of the landscape sets.

Heart-coherence for men and women
Heart-coherence for men (blue) and women

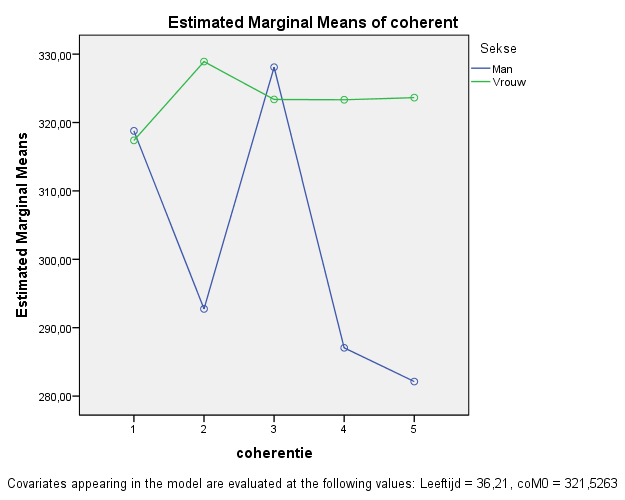
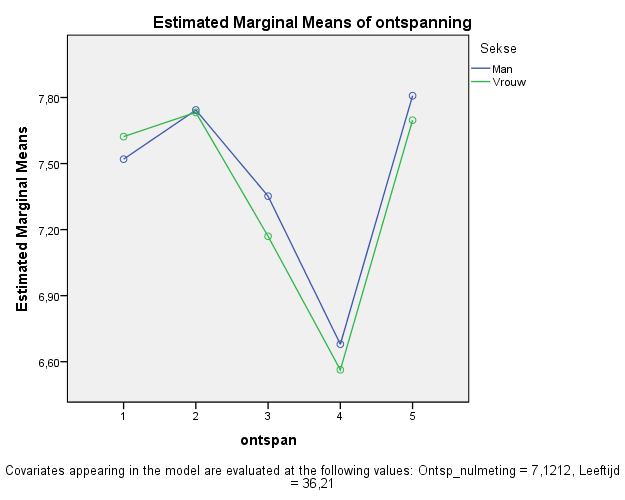
There is a significant trend for the age coherence interaction. Looking at the graph we can see that the coherence for the women is almost the same over the 5 sets but higher then the baseline coherence measurement. The men show a much more varied response and on average a lot lower then the baseline measurement. It is interesting to note that the abstract painting set, number 3 has a very high score for the men.
Looking a bit deeper into this trend there is again a relation to age. For the younger participants there was no significant difference between the sexes where heart-coherence is concerned. The graph of the older participants shows a significant difference between men and women. The older men cause the interaction-effect between gender and heart-coherence.

Difference in heart-coherence between older men and women
Difference in heart-coherence between older men (blue) and women

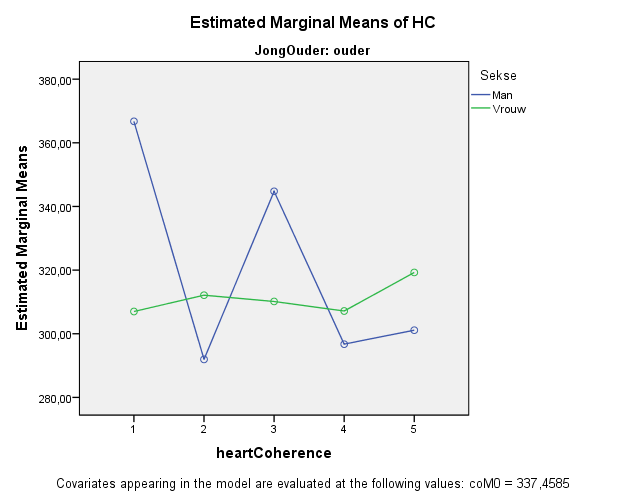
So although the average heart-coherence for the hospital interior set (4) is at the lower end for both men and women the effect isn’t convincing in view of the other scores of the other sets. The results don’t support the hypotheses.

Conclusions
For an exploratory first experiment the analysis has yielded some interesting results. The main hypotheses that the self-reported relaxation, heart-coherence, BPM would be lower  for the hospital interior set (4) than for all of the landscape sets is partly supported.
The self-reported relaxation and the heart-coherence showed significant results.

The lack of significance for heart-rate may be due to the small group or may suggest that the differences between the sets wasn’t big enough. To influence this I want to reduce the amount of sets in the next experiment and introduce a stress stimulus to create more contrast between the states of the participants.
Judging from the analyses it is clear to me that for next experiment the age should be more homogeneous.
For me the most surprising and promising was the high heart-coherence of the men on the abstract paintings. People were skeptical about using these abstract stimuli as there is not much support in literature that non-realistic images have any effect on viewers. Of course this will require more research but it is an interesting and unexpected result.

Quantified Self Conference Europe 2014

For the third time I’ve visited the Quantified Self Europe conference in Amsterdam. I had been looking forward to it but was also a bit nervous because I was asked to take part in a panel discussion on Sunday morning. I felt very honoured of course to have been asked to talk about my Reversed calendar project which I finished last year. The discussion topic was on long term tracking. Apparently it is not something a lot of people have done. We got a lot of questions and hardly any experiences from the audience. The talk went well and it was nice to hear the other speakers. Especially Alberto is quite a die-hard, logging the most crazy things. He’s also an artist and it is interesting to see the different approach artists take on collecting data about themselves. The starting point that you use your personal data as material to make stuff is so different from other approaches. The goal is not to improve but to become aware and study yourself through the collecting, more then through the actual interpretation of the data.

QSEU14 talk

Here’s what I did:
Grief and Mood Tracking (Breakout session)
Whitney Erin Boesel, Dana Greenfield
What happens when you’re tracking, but not looking to change you how feel? Join us to discuss the ways we can use different techniques to work through the process of loss and grief.
Dana gave a very moving and inspiring opening talk about how she is tracking the memory of her mother who passed away recently. She used simple tools like a Google form and pictures to log things that reminded her of her mother. I’d already decided before that I’d like to join this breakout as I’ve made a cd-rom about the death and remembrance of my mother and my grieving process back in 2001.

breekbaarEnDiversen
Someone suggested that it would be interesting to track how the grieving network around you changed as time moved on. For me the reason to make this cd was partly because of a lack of network…
The question came up if someone had experienced grieving with and without tracking. I was in the unfortunate position to have experienced both. I was quite a discovery for me that the making of an art-piece was much more helpful in the grieving process than just tracking my mood. The latter was just a conformation of my sadness while in the art making process I could transform this into something beautiful that I could share.

Ignite Talks
Washing My Eyelids
Steve Dean
Steve will demonstrate how he used self-tracking tools to get under atopic dermatitis.
Tracking his eyelid inflammation was useful to him in talking to his doctor but didn’t yield any insights on its own. This was an interesting talk because of the frustrating process Steve was tracking and the way he kept going in spite of the lack of results.
Analyzing Changes in My Weight and Sleep
Kouris Kalligas
Kouris spent thirty hours combining his multiple data streams into one place, and learned what influenced his weight and sleep.
What was interesting for me here was the thoroughness with which Kouris had looked for correlations between the things he tracked. He also made a list of expected findings at the beginning of his quest and compared these with the outcomes of his analyses. One finding intrigued me: higher fat percentage during the day led to a better sleep. I think that might have to do with feeling more satiated And therefore eating earlier. I’m going to do a little experiment myself on the correlation of food and beverage intake and working late and sleep quality (view below).
Fit 50s Sound 60s
Maria Benet
Maria has been tracking for almost 10 years, developing strategies for improving and maintaining her health as she ages.
I really enjoyed this talk by Maria. First of all because she’s not your usual QS suspect. I found it very refreshing to hear a story by someone who step by step discovered self tracking because she wanted to lose weight and become fit again. Here was this somewhat older lady talking about all these apps and devices with a lot knowledge from experience. I liked the Excel sheet in which she manually annotated and combined different measurements go gain more insight. A quote from Maria that I wrote down: Small habits add up to a big impact in the long run.
A Testosterone and Diet Experiment
Maximilian Gotzler
Blood tests showed Max he had low levels of Vitamin D and Testosterone. Could diet changes help?
What I liked about this talk was the thoroughness with which Maximilian tried to tackle his deficiencies. He had all kinds of blood test done which I didn’t know existed. Would I be able to afford them?

Photo Lifelogging as Context for QS Practice
Cathal Gurrin, Niclas Johansson, Rami Albatal
Learn how to use computer vision to extract metadata from lifelogging photos, enrich a photo timeline with other personal data, and draw insights from massive longitudinal photo collections.
I’ve been thinking a lot about easy food logging and behaviour tracking through pictures. I would make my life so much easier if these things could be automated. So I was really happy when I read this was a topic of one of the breakout sessions. It was a very interesting but sobering talk. No way am I going to write my own program or app to log my food or extract activity from a picture. It takes the experts a _very_ long time to write classification algorithms for every object. It all has to be annotated by human hand.
But fortunately they are open to collaboration. I think automated food and calorie logging will be very big. So I offered to work on the annotating if it can eventually lead me to my food being logged with the right amount of calories while I eat! They were also interested in my behaviour tagged pictures from the north-southfeeling project. So if they’re helpful I’m happy to share them.

Sensing Smell
Jenny Tillotson
Scent has the power to profoundly affect our psychology and physiology. Learn about the state of the art in smell tracking, interpretation, and use.
Smell is something I’ve been interested in for a long time. I’ve used it in the AQAb wearable of course. But for me personally smell is also very important. Jenny is a designer of wearables who is really deep into everything about smell. She’s working on a device that can reduce stress and improve sleep through scent. Being an academic she has the opportunity to work with lots of experts in the field, I envy that sometimes. As an artist you have to do so much on your own.
A lot of aspects about scent and smell still remain a mystery. Digitalising scent is still far of. I asked her about enhancing meditation with scent. She said there’s an interest in that lately, in the realm of mindfulness and she will e-mail some pointers on where to start with that. Great!

Neuroscience & EEG
Martin Sona
This was an unplanned breakout session with neuroscientist Martin Sona on the latest developments in devices and applications for the QS community.
Martin is a really nice and accessible guy. I knew he had a lot of knowledge on open source EEG but I had no clue he was a neuroscientist working as a researcher at the university of Maastricht.
I’ve been looking for an easy way to capture brain data. I was very enthusiastic about the TrueSense wearable bio-sensor kit that was at the QS conference last year. But I couldn’t really work with it because I couldn’t figure out how to get to the live data and it was very hard to interpret the streams. Martin has been collaborating with them and made some patch in BrainBay an open source Bio- and Neurofeedback Application that can be used with the TrueSense kit. Wow, looking forward to trying that out. Martin is looking for ways to be able to place the sensor at different sides of the head. I will look into that for him. I want to integrate it in a wearable anyway.

On top of all these inspiring talks and exchanges I was lucky to make contact with a lot of people. Some from companies, some just participants, some I’d met before others new. There’s a lot of time to talk to people and the insights you get from them and hopefully give to others is just so rewarding.

And I’ve done an ‘impulse’ purchase. It wasn’t really an impulse as I slept on it but for me it is quite something to buy something over a 100 Euro without weeks of deliberation. I’ve ordered an Emfit device. It’s a sleep tracker that can distinguish between different sleep phases and track heart- and breathing rates when you sleep. It can even do heart-rate variability. They’re working on a downloadable csv file of your data and an API. All data is send wireless from a non-contact device under your bed sheets. I’ve wanted a sleep tracker for years. Can’t wait to try it!

Photo Ian Forrester

Finally there was quite a distinct buzz about empathy and including others in your tracking. Kaiton Williams gave an interesting opening speech where he mentioned tracking for empathy. I’ve always wanted to inspire and give to others with my tracking by transforming it into art. But I’m looking for ways to make it more concrete. Quite a few people came up to me to talk about the subject. I might even do something to improve animal well fare using the breathCatchers. It is good to see that others are also looking for ways to reach out and share more.

All in all a very, very inspiring and uplifting experience. I’m already looking forward to next year.

Virtual View: conducting the first experiment

Now that the research goal is clear, the stimuli are collected and the methods are clear and integrated in the EventIDE experiment it was time to look for participants. We needed at least 30 participants equally divided between men and women. Avans Hogeschool  has thousands of students and staff so we didn’t expect that to be a problem. The students wrote an inviting message on a digital notice board asking people to participate but only got two reactions. Enter the next strategy: walking up to anyone they met and just ask them to take part. That worked a lot better and most of the participants were recruited in this way. Some of the classmates were invited through text messages as well. In the end 33 participants took part, a mixture of students and staff.

Photo by Carlos Ramos Rodriguez

The students arranged the lab set-up and together we determined the protocol. The lab was a small classroom with a smart board with speakers. The students cleared most of the room, leaving it clutter free. The table was installed at a distance of 250 cm from the smart board. The projection was 154 x 108 cm. For the record I checked the sound levels of the different sets in the lab set-up with my decibel meter. They might have a strong influence so it is good to know at what average levels the sounds were played.

The sound level during the baseline measurement (no sounds were played) was 33 decibel. The autumn set with repetitive bird sounds 47 decibel, deflecting vistas with birds and running water sounds 43 decibel, hospital interiors with hospital waiting room sounds 48 decibel, standard preferred landscape with running water sounds 48 decibel and abstract landscape paintings with melodious bird songs 56 decibel.

Sketchup made by students Avans

The students lead the experiment, I came for the first couple of trials to taste the atmosphere and give some tips. At arrival people were welcomed and asked to turn off their phones. We also asked if they’d been to the bathroom. Because we use quite a lot of running water sounds and the experiment lasts around 20 minutes this might become an issue for people. We didn’t want them to get distracted because they needed to go to the bathroom and couldn’t. The sensor was placed on the earlobe. Participants were explained the course of the experiment and told that all data was anonymous and that they could leave at any time should they feel the need to end the experiment.

Participant id, age and gender were entered by the experiment leaders and then the participants were left alone with the stimuli and the questions.

As soon as the experiment was over the leaders would enter the lab for removal of the sensor and debriefing. Most participants were enthusiastic about the experiment and agreed to take part in the next experiment.

The next step is analysing the data, I can’t wait for the results!


Virtual View: research methods

How does one research the influence of landscape and sound on a human? Fortunately a lot of research has gone into finding out how people react to visual landscape stimuli. Most articles I’ve read made use of static pictures, some used video. As pictures can be found in abundance on the web and are easily stored and manipulated I chose static colour pictures as the main visual stimulus.

In most experiments natural landscapes are compared to urban environments with varying amounts of green. Almost always the natural and greener urban scenes have more positive effects on health and affect related variables compared to the urban environments. So it seemed logical not to use the pictures of urban environments. Together with the students I decided on using landscape pictures that were at odds with the most preferred landscape. So that would be: chaotic natural scenes with a restricted view and no deflected vistas or water. As I discussed my experiment setup with Sarah she strongly recommended I’d use a control set of stimuli. That way I could (hopefully) confirm the findings from other experiments and I’d have a contrast set to compare the natural scenes to and hopefully see significant differences between the contrast set and the different landscapes. As the installation will be placed in health care environments I decided to make a set of neutral hospital interiors as a contrast set.

stimuli

The final installation will be an animation so I wanted to use sets of landscapes to mimic a little the animation effect. We decided on sets of 6 images. Then we had to figure out what time the images would need to be shown to have a measurable effect. Not very much could be found in literature about this so the students did some tests, showing the images for different time periods. The result on the heart-rate was very diverse. So I consulted Malcolm and asked him what to make of this. He said the sample was too small to conclude anything. His suggestion was to show people two sets with the images displaying at different lengths and then to ask people what they preferred. He had already pointed out earlier that it does take some time for stimuli to take effect. Unfortunately the students only tested 10 and 25 seconds to compare. From that they concluded that 25 seconds was a bit too long but that people preferred the longer exposure. So we settled for 20 seconds per image. And each set would last two minutes.

Of course a baseline measurement was needed for the heart-rate as well as the self reported data (view below). For the experiment to have any scientific value Malcolm said I needed at least five minutes of baseline measurement. Not to complicate things further Hein advised to not make use of any specific stimulus but just use an empty screen. It would be quite a long time to sit there and do and see nothing, but it would be for the good cause!

As I reported earlier the research on the effects of natural sounds has been a lot more sparse. But as with visual landscapes water was perceived as more pleasant compared to for example mechanical sounds. And aesthetically pleasing an non-threating bird sounds seem to indicate a positive effect on attention restoration and stress reduction. So we used different combinations of water and bird sounds. The hospital interior set was accompanied by sounds from a hospital waiting room.

In this review of health effects of viewing landscapes there’s an extensive list of research and physiological parameters measured. For Virtual View I’m interested in heart-rate and heart-coherence. Further more I would like to know how a certain landscape makes people feel. I want the installation to have a relaxing effect and to positively influence a sense of well-being. For measuring the physiological side I of course use the Heartlive sensor. I measures beats per minute and calculates heart-cohere. The EventIDE software logs the heart data every second and calculates means for every picture.

Not only do I not own a device to measure for example skin conductivity (GSR) I’m also curious about how people feel when watching the sets. So I needed some record of perceived relaxation state and affect. It was not easy to find a (short) questionnaire which measures that. Malcolm pointed me to the Smith Relaxation States Inventory 3 (SRSI3). It is a very interesting and validated inventory but alas consists of 38 items. It doesn’t make sense to ask people 38 questions after two minutes of pictures. The questionnaire may not be modified without consent so I asked Sarah what to do. She suggested to simplify things and just ask people how relaxed they are on a 10 point scale.

She said 10 points are better then five because it is easier to see the middle and it is more fine grained. It gives people the opportunity to pinpoint how they feel. We settled on three questions: I feel at ease, I feel relaxed, I feel joyful and happy. If my installation can make that happen I’m satisfied no matter what the heart-cohere or heart-rate is. All questions are integrated in EventIDE. Carlos, one of the students, made a nice colour feedback on the scale.

The students take notes of remarks the participants make on their experience of the trail. This may also yield interesting results in relation to the experiment data.

Virtual View: building an experiment

I was very lucky to meet Ilia from Okazolab. When I told him about Virtual View and the research I was planning to do he offered me a licence to work with EventIDE. This is a state of the art stimulus creation software package for building (psychological) experiments with all kinds of stimuli. Ilia has build this software which was, at the time I met him, still under development. Besides letting me use the software he offered to build an extension to work with the Heartlive sensor. He’s been very supportive in helping me to build my first experiment in EventIDE.

It is a very powerful program so it does take a while to get the hang of it. The main concept is the use of Events (a bit similar to slides in a PowerPoint presentation) and the flow between these events. Each event can have a duration assigned to it. On the events you can place all kinds of Elements ranging from bitmap renderers to audio players and port listeners. Different parts of the Event time line can have snippets of code attached to it. The program is written in .NET and you can do your coding in .NET and also use XAML to create a gui screen and bind items like buttons or sliders to variables which you can store.

You can quickly import all the stimuli you want to use and manage or update them in the library. From the library you drag an item onto a renderer Element so it can be displayed and gets a unique id. We’ll use this id to check to responses to the individual images.

The Events don’t have to follow a linear path. You can make the flow of the experiment conditional. So for my design I made a sub layer on the main Event time line which holds the sets of images and sounds. The images in each set are randomised by a script and so are the sets themselves as we want to rule out the effect of order of the presentation. So in the picture you can see the loop containing a neutral stimulus, 6 landscape pictures with a sound and a questionnaire. This runs 5 times and goes to the Event announcing the end of the experiment. During the baseline measurement and the sets the heart rate of the participant is measured. And the answers to the questions belonging to each set are logged.

Data acquisition and storage is managed with the Reporter element. You can log all the variables used in the program and determine the layout of the output. After the trial you can export the data directly to Excel or a text or csv file. Apart from just logging the incoming heart rate values we calculated mean from them inside EventIDE for each image and for the baseline measurement. This way we can see at a glance what is happening with the responses to the different images.

For me it was kind of hard to find my way in the program. What snippet goes where, how do I navigate to the different parts of the experiment? But the more I’ve worked with the program the more impressed I’ve become. It feels really reliable and with the runs history you are sure none of your precious data is lost.

Virtual View: designing the first experiment

I had an idea what I wanted to research in my first experiment after reading the different articles. Looking at the end users, frequent visitors to hospitals and the chronically ill, I want the final piece to be first and foremost a pleasant and relaxing experience. It would be nice if there was an actual physical change that can be measured. The piece should have a stress reducing and restorative effect too. This can be both a subjective experience and a quantified measurement in form of heart-rate and heart coherence. And there are of course the landscapes and the sounds that should induce these states.

So how do you convert these goals into an experiment design? You follow a course and you ask people who have a lot more experience with designing psychological experiments!

I started out with way too complex idea. Combining stress induction and testing stimuli effects in one experiment. I’ve had great input from my professor Hein at the Open University, Sarah (PhD in psychology), Ilia (developer of stimulus creation software) and Malcolm (information scientist and psychologist) from Heartlive. Discussing my idea’s with them helped me a lot.

Together with the students I looked at the type of landscapes and sounds that would be most valuable to explore for the Virtual View installation. We’ve decided to test 5 sets with 6 landscape images based on, among other things, the most preferred landscapes as defined by Ulrich. We also explore the mystery aspect of landscapes as outlined in the attention restoration theory by Kaplan and Kaplan. Each set of images has a sound to go with it. We use one contrast set of neutral hospital interiors accompanied with hospital sounds. Another thing we want to explore is non photo realistic landscapes. As the final piece will consists of computer generated graphics with a certain degree of abstraction we want to compare the response to abstract landscape paintings to the photo realistic material.

From the little research that has been done on the effects of (nature) sounds we’ve come to different combinations of running water and birdsong. These are the sets and sounds {in curly braces}:

a. Preferred landscape with water element {running water}
b. Preferred landscape in autumn {repetitive bird calls}
c. Neutral hospital interiors {neutral hospital sounds}
d. Landscape with deflecting views {running water and melodious birdsong}
e. Preferred landscape as abstract painting {melodious birdsong}

While experiencing the stimuli the participants’ heart beat will be measured with the Heartlive sensor. This will give data in the form of beats per minute, inter beat interval and heart coherence. A questionnaire on the perceived relaxation state will give insight into how the different stimuli sets are experienced by the participants and how they effect their sense of relaxation.

We expect combination d) the have the most positive effect compared to the other sets: higher IBI values, lower BPM values and higher coherence and the most self reported relaxation. The neutral hospital interior we expect to score the lowest means on those variables.

The sets and the images in the sets are randomised for each participant. The sounds are attached to one set. The participants will see all the sets (repeated measures). In the end we’ll be able to compare the different means of all the sets.

In the next blog I’ll explain more about building the experiment in EventIDE, the stimulus creation software I mentioned above.

Virtual View: Literature research

To get a better idea of which type of landscapes and sound have the biggest effect on (experienced) relaxation explorative research is necessary. At the end of January I started the research trajectory for the project. This is a collaboration with students from the minor “Active ageing” from the Avans Hogeschool. The three students are: Simone van den Broek, Carlos Ramos Rodriguez and Denise Hereijgers. There is support from two teachers from Avans: Marleen Mares and Lowie van Doninck.

Both the students and I started on a literature study. The main questions being:

Which visual elements in a landscape and what landscape properties have the most effect on relaxation and heart rate variability?

Which nature sounds and sound properties have the most effect on relaxation and heart rate variability?

Which emotional, physical and cognitive aspects influence stress and relaxation in relation to nature and landscapes?

To get the students started I made a list of tags to search on: Environmental psychology, Stress, Arousal, Heartrate Variability (HRV), Heartrate coherence, Relaxation, Landscape Aesthetic Quality, View, Landscape preference, Environmental aesthetics, Restorative environments, Attention restoration theory (ART), Stress recovery, Sounds, Birdsong, Stress Recovery Theory (SRT), Skin Conductancy Level, Effortless attention, Soft fascination, Aesthetic, levels of complexity, pattern, depth, surface texture, mystery within an environment, acoustic properties of animal sounds: smoothness, intensity, pitch, biophilia.

There are a couple of authorities in this field: Roger Ulrich and Kaplan & Kaplan. They have done extensive research on visual landscape preferences and restorative properties of nature. While the students search was broader my main focus was on environmental psychology. There has been quite a lot of research on the effect of viewing landscapes and natural scenes versus urban scenes. A lot less research has gone into the effect of nature sounds on health and relaxation.

From Human responses to vegetation and landscapes Roger S. Ulrich (1985)
An example of a preferred landscape from the article Human responses to vegetation and landscapes Roger S. Ulrich (1985). This is the kind of landscapes we’ll use in our experiment.

For me this was my first experience of reading scientific articles on one theme. Some of the findings conflict and I had a hard time combining the theories and findings into a coherent story. (A more official article will follow later.) One of the students suggested looking at the virtual aspect of the piece and how that influences the experience. I hadn’t thought of that so that was valuable input to explore. Most difficult is to draw the line at one point and start thinking about the actual experiment.

For our experiment we’ll be using sets of static images accompanied by existing nature sounds. Three sets of landscapes are based on preferred and fascinating aspects of landscapes as researched by Ulrich and Kaplan & Kaplan. One set of landscapes consists preferred landscape scenes but in the form of abstract paintings. A contrast set consists of neutral hospital interiors. For the sounds we have chosen different combinations of water and bird song sound. As a contrast we’ll be using sounds from a hospital ward. More about the actual experiment design and consideration in the next blog.

Virtual View: about

Virtual View is a biofeedback, multi media installation that responds to the heart rate of the user. The heart rate is sensed and analysed by the Heartlive module. A heart coherence training tool developed by the Dutch company Heartlive. The user views animated landscapes and hears nature inspired sounds both generated by the computer. The sound and images change to aid the user to get or maintain heart coherence. These generic graphic and sounds are optimised to relax and fascinate the user and make relaxation subconscious, similar to a walk in a natural environment. The aim is to use artistic sounds and visuals that aren’t necessarily realistic but still have the same relaxing effect as the real experience. The main audience is the chronically ill who frequently visit hospitals. The installation will be placed in hospital wards.

Credits:
Concept, design, research design
Danielle Roberts

Research and execution experiment 4
Department of Human-Technology Interaction, Technical University Eindhoven. Students: Joep Snijders, Niels den Boer, Daphne Miedema, Yvonne Toczek. Supervision: dr. ir. Femke Beute (PhD).

Research and execution experiment 1 & 2
Avans Hogeschool Students: Simone van den Broek, Carlos Ramos Rodriguez, Denise Hereijgers. Teachers: Marleen Mares, Lowie van Doninck, Inge Logghe.

Business plan
Avans Hogeschool  Students: Daan van Mol, Thijmen Mouws. Teacher: Sandra van Breugel.

Sound design and production
Julien Mier

Advice interaction design
Beer van Geer

Development Virtual View chair
Aloys Bekken

This project is made possible by:
Impulsgelden & BKKC (funding for innovative art projects of the province of Noord-Brabant)
Heartlive (hardware, software and support)
Okazolab (EventIDE software and support)
Amphia hospital (exhibition of the prototype)
Many thanks go to: Sarah Banziger, Hein Lodewijkx, Petra van der Schaaf, Marie Postma.

ImpulsgeldLogos

library atmosphere

The past couple of weeks I’ve been working on an assignment for the municipal library. The task was to let people present their views on the library of the future. To that end we created an area with seats, a bar, a touch table and lights. By touching a picture on the screen visitors could select a different atmosphere and actually change that by at the same time changing the colour of the lights. The choices of the visitors were logged in a file. This installation was presented during the Cultuurnacht (culture night) in the city of Breda, the Netherlands.

My task was to make the interactive application and drive the lights. I’ve wanted to experiment with interactive lighting so I can apply it in my Hermitage 3.0 project. So for me it was a great opportunity to learn about it. And learn I did.

My idea was to work with the Philips Hue. They have a great API and an active community. But due to budgetary restrictions I had to work with an alternative: Applamp, also known as Milight. The concept is the same: a wifi connected bulb can change colour and brightness by sending code to a local server port generated by a small wifi box. Applamp also has a phone app to work with the lights and a very basic API.

I had wanted to start working on the application before Christmas but this ideal scenario didn’t work out. The bulbs arrived mid January… The first task was to connect to the lights using the app. It appeared that my Android phone was too old for the app to work. So I had to borrow my neighbours’ iPad. The bulbs can be programmed into groups but you have to follow the steps in communicating with the lights otherwise it won’t work.

Applamp with iPad app

Once the bulbs were programmed I thought it would be easy to set up a simple program switching a bulb on and off. I’d found a nice Python API and some other examples in different languages. Non in Java or Processing though. I’ve used Processing because I wanted a nice interface with pictures, a full screen presentation and log the actions to a file.

I tried and tried but the UDP socket connection wasn’t working. So the biggest thing I learned was to do with network. I received a lot of help from Ludwik Trammer (Python API) and Stephan from the Processing forum. The latter finally managed to retrieve my local IP address and the port for the Milight wifi box, which was all I needed. (You actually don’t need the precise port, sending it to .255 is good enough.) The light technician Jan showed me a little app called Fing that makes it super easy to get insight into all the things connected to your local IP.

In Processing I wrote the interaction making sure that no buttons could be pressed while the program was driving the bulbs. There should be at least 100 ms between the different commands you send to the bulbs. This made the program a bit sluggish. But if the commands are send to quickly it doesn’t reach the bulbs and the colour doesn’t change. I had to fiddle around with it to get it stable. But the settings in my home weren’t optimal for the library. Alas there was not enough time to experiment with it there. So it wasn’t perfect but people got the idea.

This is a snippet of the program in Processing:

// import UDP library
import hypermedia.net.*;

UDP udp;  // the UDP object
int port = 8899; // new port number
String ip = "xx.xx.xx.255"; // local ip address

int[] colourArray = {110, -43, -95, 250, 145};
int currentAtmosphere = -1;

void setup(){
  udp = new UDP(this, port);
  startState = true;
  RGBWSetColorToWhiteGroup1();
}

void mouseClicked(){
  currentAtmosphere = 1;
  RGBWSetColor(byte(colourArray[currentAtmosphere]), false);
}

void RGBWGroup1AllOn(){
  udp.send(new byte[] {0x45, 0x0, 0x55}, ip, port);
}

void RGBWSetColorToWhiteGroup1(){
  RGBWGroup1AllOn(); // group on
  myDelay(100);
  udp.send(new byte[] {byte(197), 0, 85}, ip, port); // make white
  udp.send(new byte[] {78, 100, 85}, ip, port); // dim light
}

void RGBWSetColor(byte hue, boolean tryEnd){
  RGBWGroup1AllOn();
  myDelay(100);
  udp.send(new byte[] {0x40, hue, 0x55}, ip, port); // send hue
  myDelay(100);
  if(tryEnd){
    udp.send(new byte[] {78, 100, 85}, ip, port); // dim light
  }
  else{
    udp.send(new byte[] {78, 59, 85}, ip, port); // full brightness
  }
}

Another thing that’s puzzling is the hue value that has to be send. As all the codes send to the bulbs should be in byte size the hue must be a value between 0 and 255. The hue scale of course is from 0 to 360 degrees. I’ve figured out how they are mapped but found out by just trying all the values from 0 to 255.

I’m happy to say that the installation was a success. People thought it was fun to work with it and I had some nice insights into peoples idea’s for the library of the future. The final presentation could have been more subtle. But that’s something for next time.


First sonification workshop

From 20 to 24 of November last I took part in the first sonification workshop at OKNO in Brussels. This workshop is part of the European ALOTOF project. I’ll be working with them for the next two years on building a laboratory in the open field and making audio-visualisations of environmental and physiological data. Some thoughts on the workshop and subject:

– What is your idea about ’sonification’ or even ‘audiovisualisation’?
I would like to use sound/silence and light and for example air flow to influence my inner state. I’d like to measure environmental and physiological data, turn them into actuators and then measure again to see the results.

– What were you working on in the workshop?
I had to invest a lot of time in reading the values from my decibel meter through the serial port with Processing. As measuring noise is important for my plans I had to tackle that first. Unfortunately it took a lot longer then expected.
As I’m quite new to the world of sound I’ve explored some basic stuff using the minim library for Processing (http://code.compartmental.net/tools/minim/). After trying some frequency modulation and synthesis which sounded awful I ended up using layers of sine waves.
I used years of mood data that I read into Processing and sonified one row of data every second. I used three sine waves: 1. the current mood 2. the average mood for that day 3. the average mood for that year. The sine waves all had mapped mood values between 400 and 60. The better the mood higher the tone.

And I worked with real-time data from the decibel meter. Again using just sine waves now with low frequencies of up to around 100. I measured the decibel level and stored it to calculate the average for up to an hour. The other sine was the current decibel level. The low frequencies didn’t disturb the silence and acted like an echo.

– What are your plans for the future workshops?
My next step will be to work with physiological data from a muscle tension sensor (http://floris.cc/shop/en/sensors/807-muscle-sensor-v3-kit-.html) and hopefully with my heart and breath rate shirt (http://www.hexoskin.com/en). I’m hoping to produce sounds that will reduce tension and lower heart an breath rate. I’m thinking of reproducing natural sounds like birdsong and rustling of leaves, etc.