The analysis of the second experiment has taken a long time. At first there appeared to be no significant results on any of the variables, except on the heart-rate during the cognitive stress task. So I consulted different people with a degree and research experience and asked for help. I’ve really learned a lot from them. They all have different approaches and ways of working so I’ve picked out all the good tips and insights. My thanks go to Sarah, Malcolm and Marie. The latter is a researcher at Tilburg University, her knowledge of statistics dazzled me. She is the one who recommended a different analyses which has yielded more significant results.
Research questions
My main questions for this experiment were: Which type of stimulus results in the most stress reduction and relaxation? And which stimulus produces the highest heart-coherence? As I want the values on that variable do drive my landscape animation.
To test these questions I used the following dependant variables: BPM, heart coherence,
later I introduced heart-rate variability calculated from inter-beat interval, self reported stress and self reported relaxation. These were measured during the baseline measurement, the cognitive stress tasks and the stimulus sets.
The independent variables are: stimulus set 1 with 12 landscape photographs and synthetic nature sounds, stimulus set 2 with more abstract landscapes styled by me with the synthetic natures sounds in the background. Stimulus set 3 consisted of 12 photographs of kitchen utensils and a soundtrack of someone preparing a salad. The expected direction of the variables will be explained below.
Analyses
After struggling for some time with the non-significance of the variables in the different sets I discovered that the randomisation of the sets hadn’t been ideal. There were 33 participants who viewed the sets in 6 different orders. On top of that the group size per order was different. Some groups were only 4 participants, others 10. This is something I’ll have to take into account in my next experiment.
I used a repeated measures analyses. On my first, non-significant results, I used my baseline measurement as a covariate. Marie said that wasn’t the way to go. So I used just repeated measures where the baseline is just the first measurement, no covariates. And I did post hoc analysis (Bonferroni) to see the differences between the set results.
This is an overview of the results:
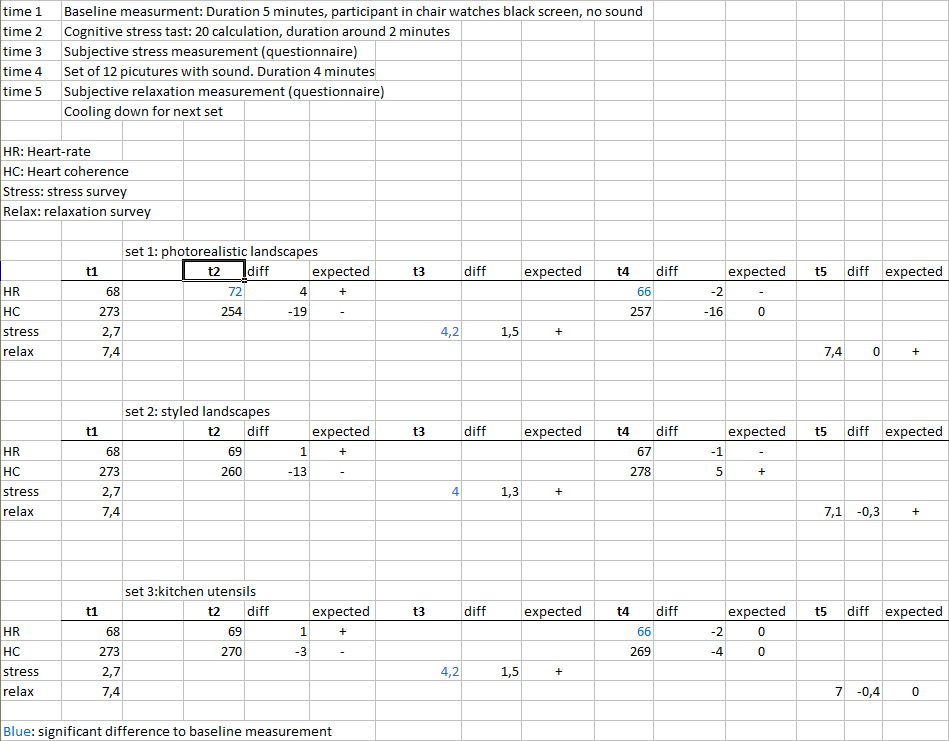
Sarah made this clear lay-out of the research results compared to the expected results.
As you can see from the blue results the subjective stress measurements are significant compared to the baseline for all three stress tasks. For the first stress task (note this task isn’t connected to set 1, it is just the first task after the baseline measurement) the difference in heart-rate is significant during the stress task. There is also significant difference in HR during the landscape set. The kitchen utensil set heart-rate is also significant. Even though the heart-coherence is has the right direction non of the changes are significant. There are also no significant differences between the subjective relaxation questionnaires.
On Sarah’s recommendation I also looked at correlation between all the variables. That is very interesting as it reveals relationships between the variables. As the subjective relaxation questionnaire didn’t show any significant results I was curious to see how it correlates with the stress questionnaire. There should be a significant negative correlation between the two. And there is, it is especially strong for the baseline stress measurement and all relaxation measurements. On the other hand there was no correlation between subjective relaxation and heart-rate, a lowering of this value may be considered an indication of relaxation. All in all the relaxation questionnaire doesn’t give convincing results. There was a very strong correlation between heart-rate and heart-rate variability. In fact too strong, as Sarah pointed out they measure the same thing so it has no use including this variable in the results.
First set
As the stress stimulus was strongest the first time (view below) Marie advised me to do an analyses on the first set that was shown after the first stress task, independent of what kind of stimulus set it was. This was the distribution: set 1: shown 11 times; set 2: 14; set 3: 8. The results from this analyses completely matched the other results. Heart-rate and heart-rate variability are significant (this is of course an average of all three sets shown), heart coherence and self reported relaxation were not. There was no interaction effect between the set shown and either the heart-rate or heart-rate variability which suggest that the order has no effects on the results.
Graphs
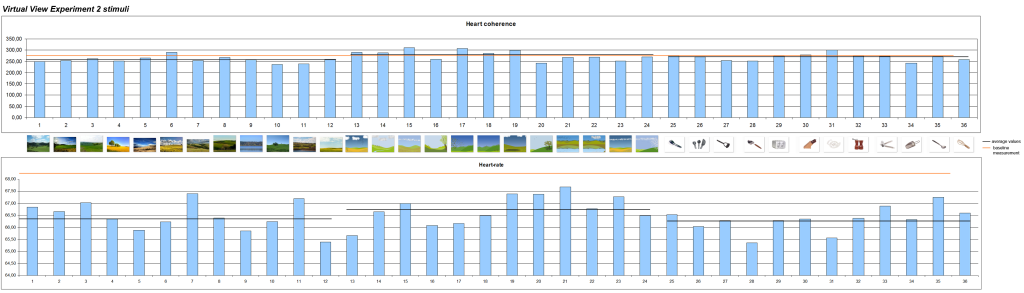
Stimulus overview
I made some manual graphs to see the effects of the stimuli on heart-rate and heart coherence side by side. There is no significant difference between the pictures in the three sets. For me it is still nice to see the difference between the pictures. The graph is done manually in Photoshop.
HRV
After getting advice from Malcolm about the results he suggested I calculate heart-rate variability from the inter-beat interval values that I’d logged. Heart-rate variability is known to correlate well with stress (negative) and relaxation (positive). So that’s valuable information to add to the results.
I wrote a script in Processing to calculate and visualise the HRV for the whole experiment divided in a 5 second windows. The white line is the baseline measurement, the red lines are the stress inductions and the green lines are the audiovisual stimuli. You can tell from the image that the stress induction has some effect.
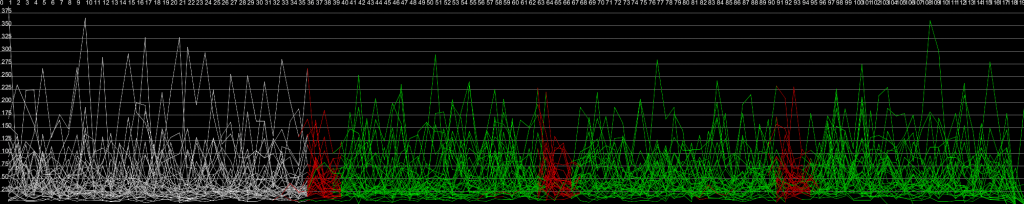
Looking at my correlation table however there is only a significant negative correlation between the baseline subjective stress measurement and the HRV. Neither the other stress measurements nor the subjective relaxation measurements show any correlation.
It is hard to tell from the image but the photo realistic landscape set has a significant difference from the baseline measurement. The third set is almost significant (p = .054).
Conclusions
The first conclusion should be that the differences between the stimuli in the sets are small. There are significant* differences in average heart-rate between the sets (68,26 (baseline); 66.46* (set 1); 66.75 (set 2); 66.32* (set 3)). But the differences are really small. There is reduction in all the sets. Set 3, the kitchen utensils has the lowest average. The set isn’t very stimulating which might explain the low heart-rate. This conclusion is also backed by the fact that the results from using only the first set shown are comparable to when working with the individual sets.
Heart coherence, which I want to use for driving the animation and to trigger the interaction with the installation showed that the styled landscapes with sounds had the highest heart coherence average but the results were not significant. It does not seem a good measure for pure relaxation. Heart coherence is a difficult term but this description gives a good indication of the different aspects of this state: In summary, psychophysiological coherence is a distinctive mode of function driven by sustained, modulated positive emotions. At the psychological level, the term “coherence” is used to denote the high degree of order, harmony, and stability in mental and emotional processes that is experienced during this mode. (From The Coherent Heart p. 12, Mccraty, Rollin Ph et all, Institute of HeartMath). On page 17 of that document it states that: “In healthy individuals as heart rate increases, HRV decreases, and vice versa.” As HRV and coherence are closely linked the same is true for heart coherence. Even though heart coherence is much broader than relaxation is also encompasses activation of the parasympathic nervous system which is also a marker for relaxation. Important in heart coherence is the inclusion of positive emotions. This is what I try to evoke by using landscapes based on generally preferred landscapes.
The Virtual View installation should provide a relaxing distraction for people in care environments. Cognitive states that relate to this goal are soft fascination and a sense of being away as introduced in the Attention restoration theory (ART) by Kaplan and Kaplan. I’m guessing now that heart coherence might correlate with those cognitive states. This is something I will explore in the next experiment.
The stress task was perceived as stressful judging from the subjective reports. These findings are partly backed by the physiological data. Only the heart-rate of the first stress task differs significantly from the baseline. Our goal by introducing a stress task was to create bigger differences in heart-rate. For that to be successful the stress task should really produce stress. Although people reported feeling stressed we can’t measure it three times in a row. So for the next experiment I’ll work with 3 groups who will all get only one stress stimulus and one landscape stimulus.
All in all this experiment doesn’t prove that my styled landscapes with synthetic nature sounds create the most relaxation and heart-coherence but the results neither prove that they don’t. So for the next experiment I’ll continue with the styled landscapes and introduce animation.