In experiment three I wanted to see if adding movement to visual content had a bigger lowering effect on heart-rate and subjective stress then just using a still. And I wanted to know if variables like heart-rate and skin conductance could be restored to or below the baseline following a stress stimulus. Sound accompanied the visuals and I used the same soundtrack for both conditions.
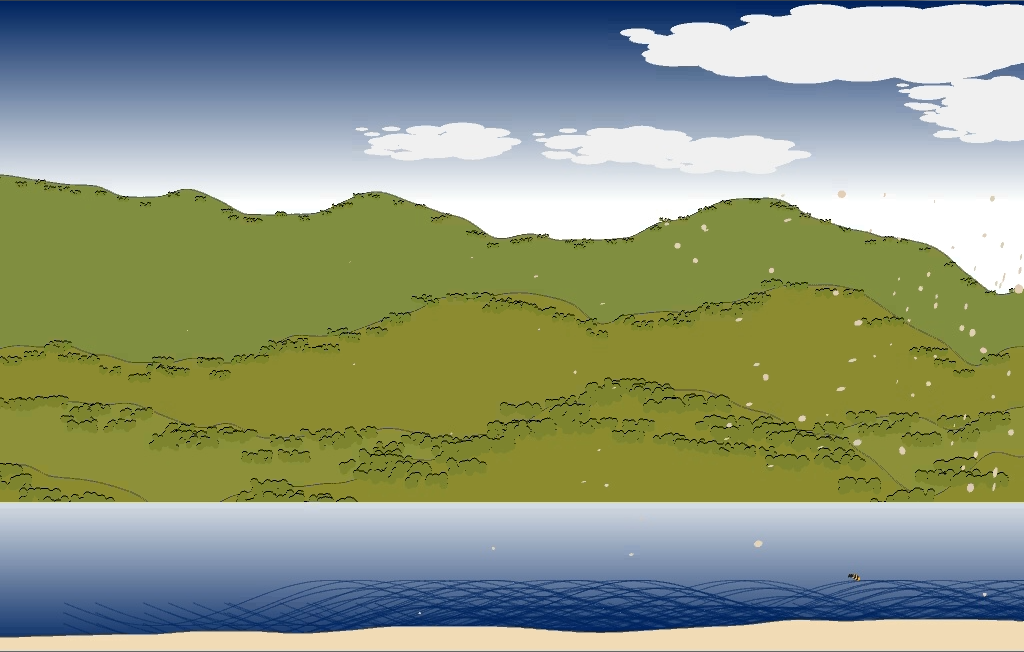
The animation consisted of a main landscape layout with different animated elements over-laying that scene. The landscape consisted of a blue sky with white clouds slowly moving over it. Three hills with shrubs in different shades of green and a blue water body with a cream coloured shore. The animations were started mostly in sequence so there were just one or two animated elements to be seen. This is aside from the clouds and the waves on the water body, they were visible most of the time. Animation still used in condition 2
Other animations are: big and small flocks of “birds” consisting of 150 and 5 “birds” respectively. They move in random directions within the frame. Blossom leaves flying from one side of the screen to the other. This animation also included a bee flying from one side of the screen in a slow, searching way. A final animation element are the butterflies. They flutter near the bottom of the centre of the screen and disappear after a random time span. The visuals are not realistic but simplified and based on the style of the old Japanese woodblock prints.
The sounds are inspired by nature but underwent a lot of computer manipulation. The sound is carefully synced with the imagery and movements on the screen.
In both conditions I measured subjective tension (7 point likert scale), heartbeats per minute, heart-coherence and skin conductivity. The experiment consisted of three stages: a baseline measurement (5 minutes), a cognitive stress task (around two minutes), the audio and visual stimulus part (5 minutes). Subjective tension was measured before the baseline measurement, after the stress task and after the stimulus. For a full description of the lab setup and experiment view the previous post.
Sample
The sample consisted of a total of 33 participants, more women then men (75% over 25%), this frequency was the same for both conditions. They were mainly recruited from the art centre where the experiment took place, there were a couple of students and some members from the general public. They were randomly assigned to each condition. The maximum age was 71, the minimum was 20 (mean 41,1). One dataset was corrupt so I ended up with 16 (mean age 39,6) participants in condition 1 (animated landscape) and 16 (mean age 42,7) in condition 2 (landscape still).
Correlations
I’ve used SPSS 20 to calculate the statistics. I was curious if the heart-rate or heart-coherence would correlate with the subjective tension and/or the skin conductance. I could find very few significant correlations between the different variables. There are only significant connections between the different measurements of one variable. So the beats per minute (BPM) of the baseline measurement correlates with that of the cognitive stress task measurement and of the stimulus (landscape) measurement. The same is true for the Gavanic skin response (GSR) and the heart-coherence (HC). The only interesting correlation I found was a negative correlation between the baseline HC and the self reported tension (SRT) of the baseline and the stimulus. The could indicate that, assuming that heart-coherence is a measure of alert relaxation, perceived tension at the start and during the task the opposite of this alert relaxation state. But the correlation is weak (-496 and -501) so not much can be concluded from that.
Condition comparison
Before comparing conditions (with or without motion) I had to check if the stress stimulus had worked and if there was an effect for the audiovisual stimulus in general. Below you see an overview of the variables self reported tension (SRT), beats per minute (BPM), heart-coherence (HC) and galvanic skin response (GSR). The values for these variables are the mean values for the duration of the different parts of the experiment: Baseline (t1), cognitive stress task (t2) and stimulus (audiovisual material, both conditions) (t3). You can also see the expected direction of the variables. The significant values are printed in green.

From the table you can tell that there is a significant difference between the baseline measurement and the cognitive stress task on the one hand and between the stress task and the stimulus. This is true for BPM, GSR and self reported tension. All values rose during the stress task and decreased during the stimulus presentation. As those measures are strong indicators for stress this indicates that the stress task worked and the tension showed significant variation during the experiment. Heart-coherence shows no significant changes.
For the heart-rate there was even a significant lowering of the mean compared to the baseline. Indicating that the BPM was even lower the when participants entered the experiment.
Of course I wanted to test if there was a difference in the variables between conditions, that way I could see if animation was more effective then using only a static image. As you can see from the table there were no significant results for either of the conditions apart from the skin conductivity (GSR). The skin conductivity is a measure for arousal, the more aroused the higher the value. I would expect the GSR to be low at the start, high during the stress task and again low during the stimulus presentation. The GSR values for the stimulus presentation were significantly lower then during the stress task but they were still significantly higher then during the baseline measurement. This indicates that the GSR levels haven’t gone back to the baseline let alone become lower then the baseline state. This might be due to the fact that it takes more time for the skin activity to go back to normal. The response is slower than for heart-rate measurements.
We can see a reduction in heart-rate for both conditions with a bigger reduction in heart-rate for the animation condition. But neither of these changes are significant.
For the self reported tension we see a significant lowering in the tension from the higher values during the stress task and stimulus presentation. This means that people felt significantly less tense watching the landscape than during the stress task. The perceived tension was also lower in the animation condition than during at the start of the experiment though not significantly so. We don’t see this effect in the static condition. For this condition the baseline was lower and the effect of the stress stimulus was stronger. The overall variation was bigger. So you can’t really draw any definitive conclusions from this data other then that the landscapes reduced arousal in both conditions.
Overall lack of significance of many of the variables in either conditions may be caused by small the sample or it may indicate that there isn’t enough difference between the conditions for it to be significant. This might be caused by the way the stimuli were presented. For the sound we used a high quality active noise cancellation headphone. The impact of the sound was big. The screen image on the other hand was rather small (84,5 x 61,5 cm). The effect of the visuals might therefore be less strong in comparison with the high impact of the sounds.
I was of course also interested in the overall differences between the conditions, especially for the landscape stimulus. When comparing the different measurement moments for BPM we can see that in every moment the heart-rate in the static image condition is lower. So the participant in the first condition already started out with a much higher heart-rate. During the stress task the difference is even bigger and during the landscape presentation the differences have become smaller. I had expected that the heart-rate in the first condition would be lower but the differences are so big to begin with that you can’t draw any conclusions from it.
So does animation have a more positive effect on heart-rate, heart-coherence, skin conductance and self reported tension? I’ve looked at the interaction between all these variables and animation but on non of the variables the effect is significant. The major effects are on heart-rate. A bit to my surprise there are absolutely no effects on heart-coherence. In the first condition we see even a (non-significant) lowering of coherence during the animation. I’m therefore not going to use this value to drive my animation as was my original intention.
Scene comparison
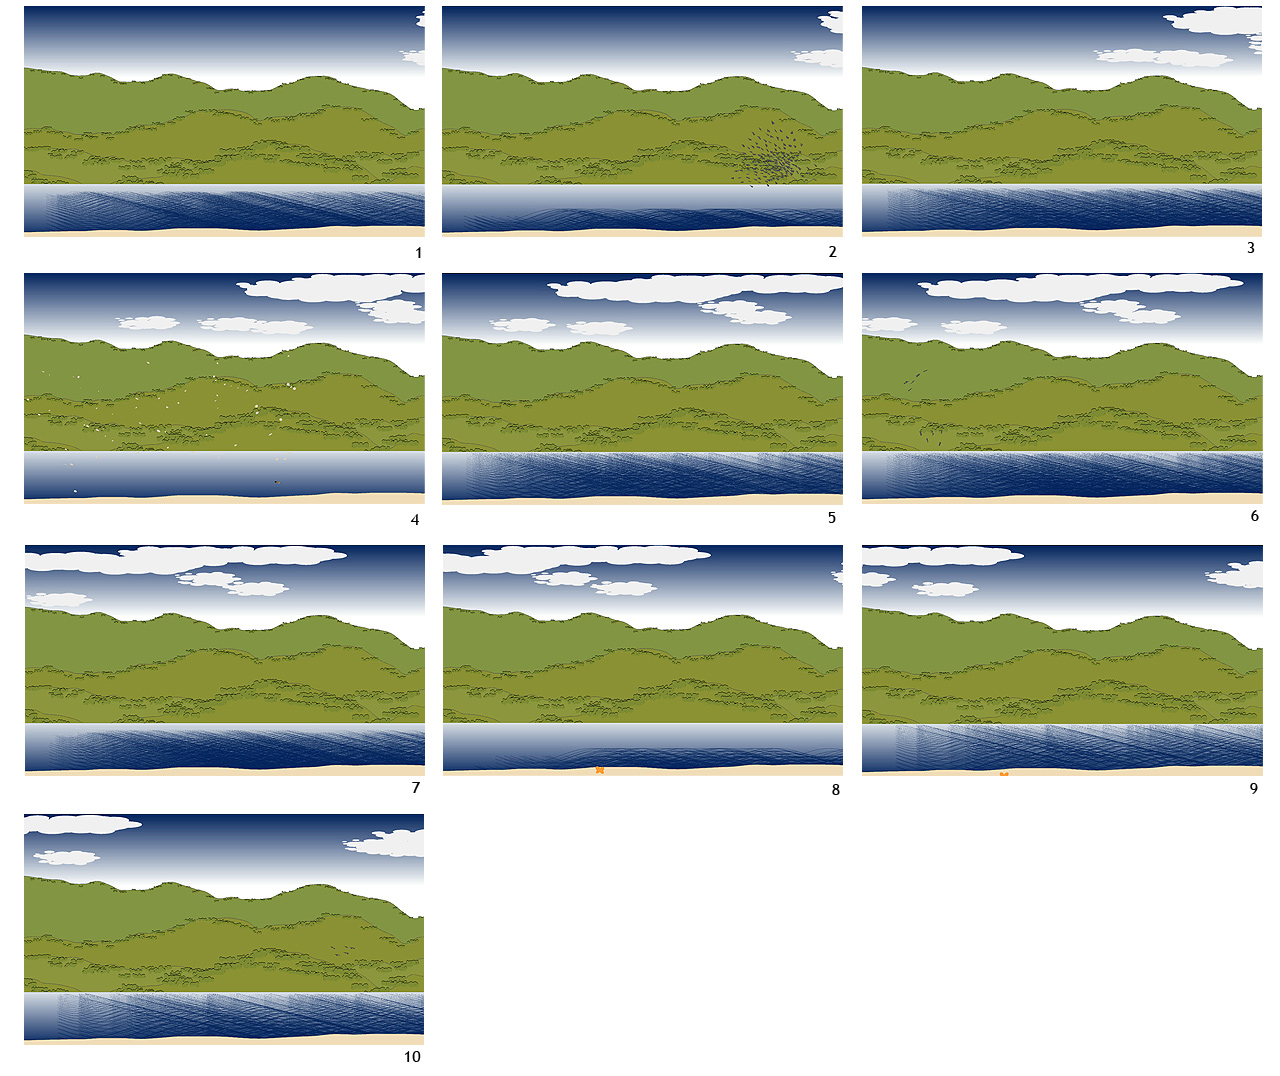
While analysing I got curious to see if there are differences between the scenes of the animation and sound in condition 1 and 2. The animation and accompanying sounds can be divided into 10 different scenes. During the construction of the video I tried to incorporate various animation elements. They become visible one after the other.
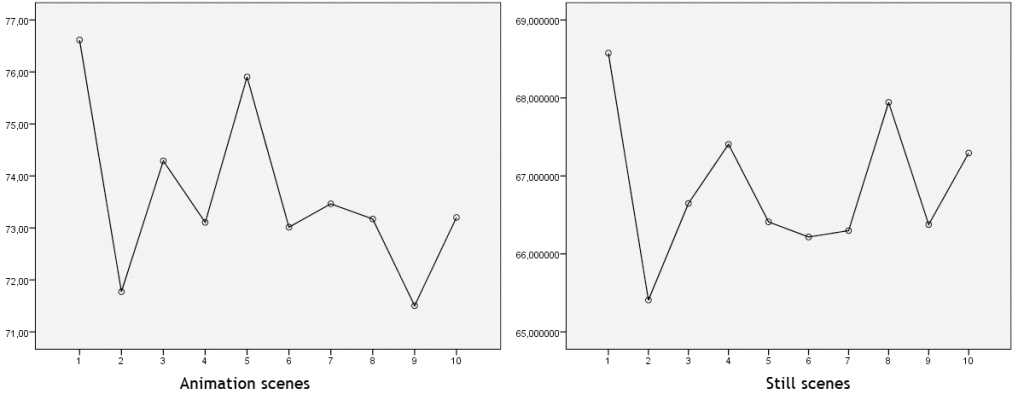
I looked at the effects on mean heart-rate because it showed the most results. I wrote a script to calculate the mean heart-rate for every scene and for both conditions. The results are show in the graph below.

The variations between the scenes were not significant for the sound with still condition but they were at two points for the animated condition. You can view stills of the scenes below. There was a significant reduction in heart-rate of 4,8 between scenes 1 (mean 76,6) and 2 (mean 71,8). And a significant reduction in heart-rate between scenes 1 and 9 (mean 71, 5) of 5,1. This could suggest that more is happening to the participants in the animation condition and that animation has more potential for influencing the heart-rate of users.
