I was very lucky to meet Ilia from Okazolab. When I told him about Virtual View and the research I was planning to do he offered me a licence to work with EventIDE. This is a state of the art stimulus creation software package for building (psychological) experiments with all kinds of stimuli. Ilia has build this software which was, at the time I met him, still under development. Besides letting me use the software he offered to build an extension to work with the Heartlive sensor. He’s been very supportive in helping me to build my first experiment in EventIDE.

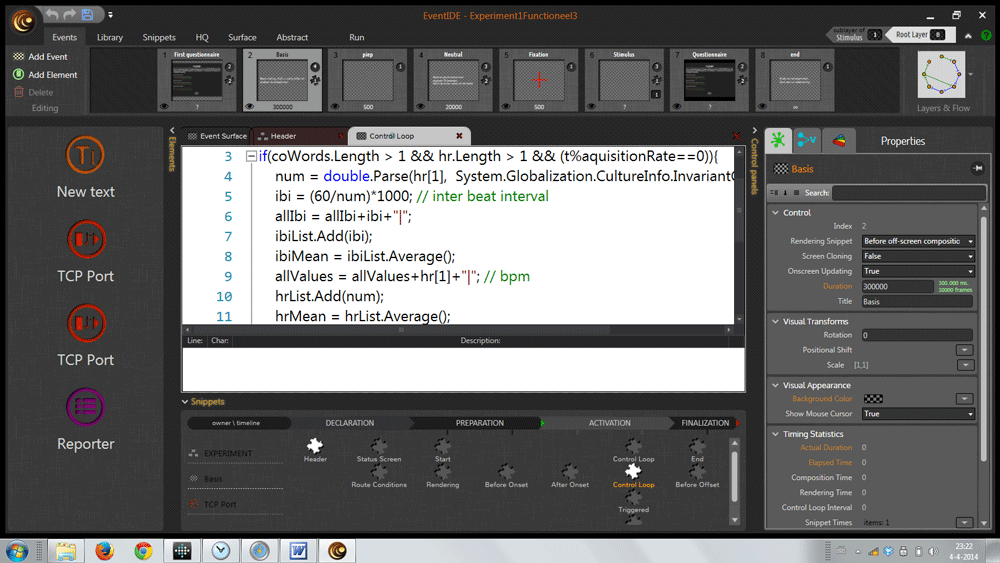
It is a very powerful program so it does take a while to get the hang of it. The main concept is the use of Events (a bit similar to slides in a PowerPoint presentation) and the flow between these events. Each event can have a duration assigned to it. On the events you can place all kinds of Elements ranging from bitmap renderers to audio players and port listeners. Different parts of the Event time line can have snippets of code attached to it. The program is written in .NET and you can do your coding in .NET and also use XAML to create a gui screen and bind items like buttons or sliders to variables which you can store.
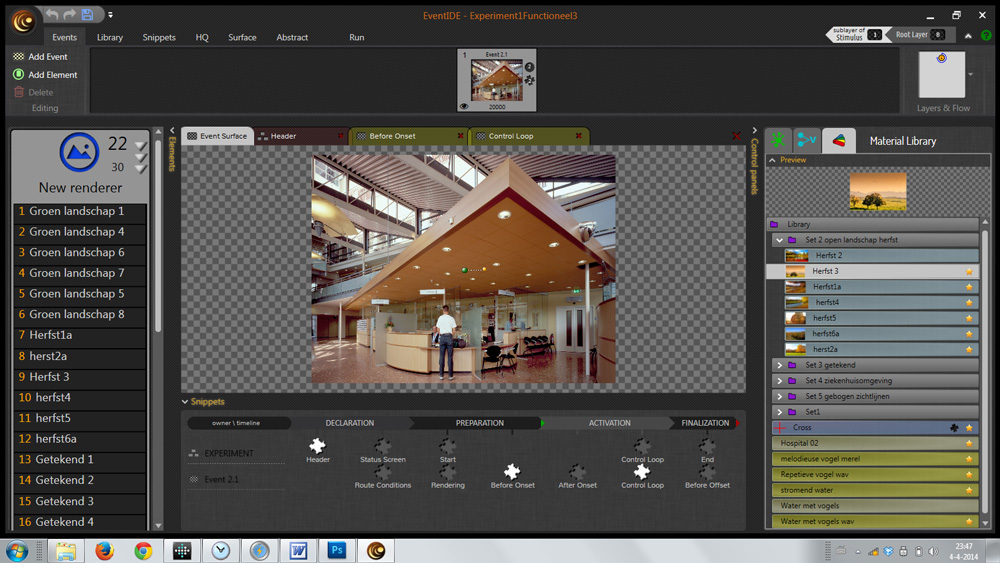
You can quickly import all the stimuli you want to use and manage or update them in the library. From the library you drag an item onto a renderer Element so it can be displayed and gets a unique id. We’ll use this id to check to responses to the individual images.

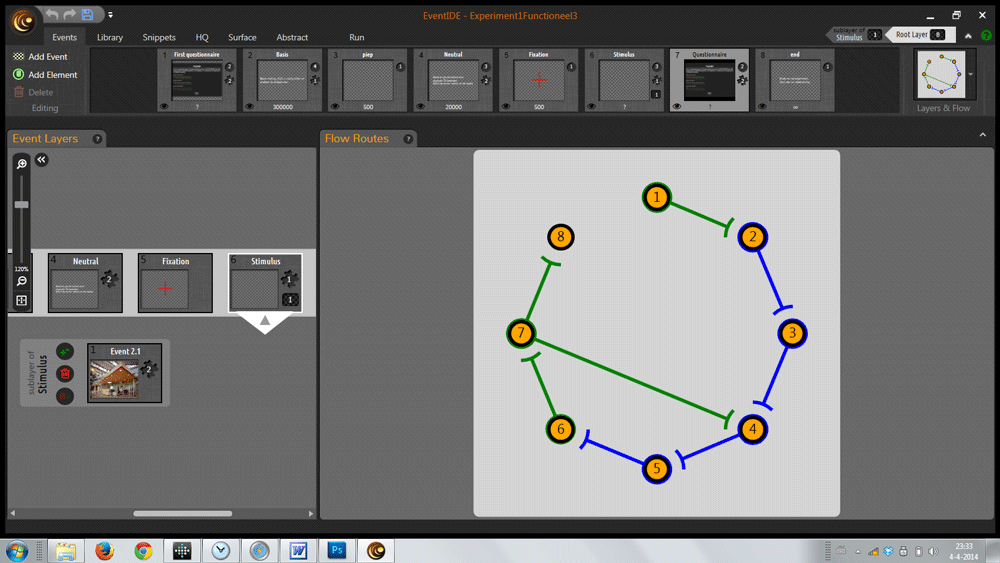
The Events don’t have to follow a linear path. You can make the flow of the experiment conditional. So for my design I made a sub layer on the main Event time line which holds the sets of images and sounds. The images in each set are randomised by a script and so are the sets themselves as we want to rule out the effect of order of the presentation. So in the picture you can see the loop containing a neutral stimulus, 6 landscape pictures with a sound and a questionnaire. This runs 5 times and goes to the Event announcing the end of the experiment. During the baseline measurement and the sets the heart rate of the participant is measured. And the answers to the questions belonging to each set are logged.

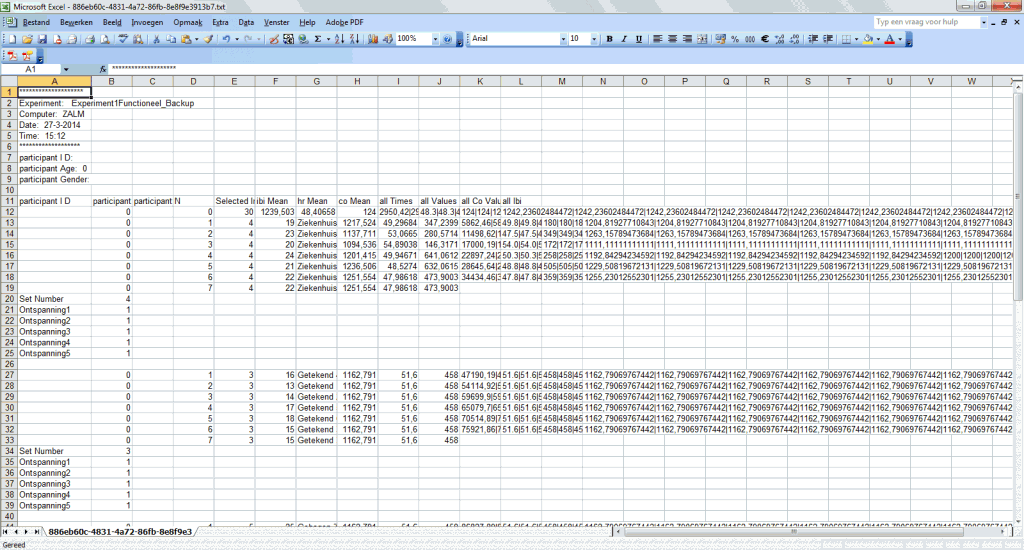
Data acquisition and storage is managed with the Reporter element. You can log all the variables used in the program and determine the layout of the output. After the trial you can export the data directly to Excel or a text or csv file. Apart from just logging the incoming heart rate values we calculated mean from them inside EventIDE for each image and for the baseline measurement. This way we can see at a glance what is happening with the responses to the different images.

For me it was kind of hard to find my way in the program. What snippet goes where, how do I navigate to the different parts of the experiment? But the more I’ve worked with the program the more impressed I’ve become. It feels really reliable and with the runs history you are sure none of your precious data is lost.