About AQAb

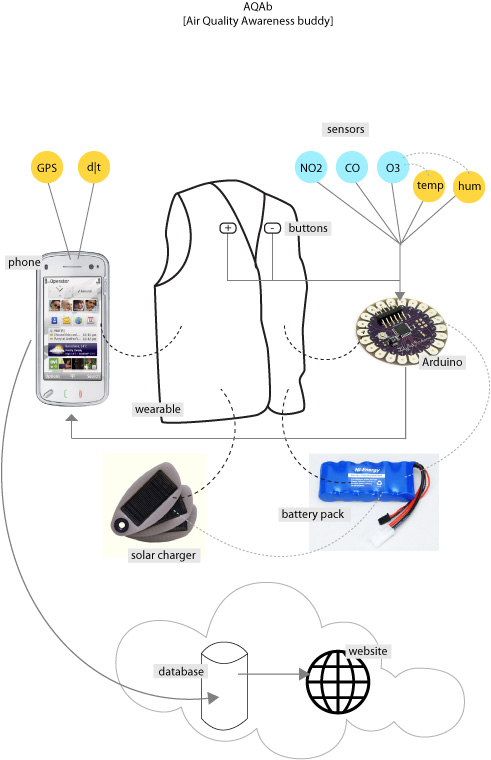
This blog is about the design and creation is of a wearable that measures, displays and shares real-time air quality data. This wearable is developed during the wearables group at the digital lab in Den Bosch. This blog monitors the progress of this process.

Data and functionality

Ten blog posts were commissioned by the Media Art Platform. Parts of this blog are rewritten and appear on their Expert Blogs section. The Media Art Platform in its original form has ceased to exist in it’s original form. It has continued as a Facebook page.

Art Pollution Kit

Michal Kindernay and Gívan Belá performing

Last night I went to Brussels to watch the performance with the Art Pollution Kit. This is a project by Michal Kindernay and Gívan Belá (Guy van Bellen.) They are making a cheap or DIY kit for measuring different kinds of environmental values. The prototype they showed last night measured temperature, light, humidity and noise. They will be extending it with other sensors like the gas sensors I’m using.
The prototype itself was very basic but what I found very interesting was their thinking about pollution. They asked themselves what is pollution in an image, in sound? They found that the degradation of the colour spectrum is an equivalent for visual pollution. Michal has been busy with visualising pollution in a very direct way: by changing the actual pixels of the image of the location where the pollution is. The image is being polluted by the data. Twenty-four hours of  data can be displayed in the image which changes over time. When there’s no pollution you get a perfectly clear picture. So the visual and environmental data are merged into one image which is very powerful. In the performance the same data was used to generate sound. This way the kit can be used as an instrument. The plan is to distribute the kits to artists at different locations, gather all the data and work with the data from the networked kits.

Michal also showed me some other visualisations of (noise) pollution he’s working on. It involves real time erasing of unwanted object (like cars) from camera recordings. That way you get a completely clean street view. The streets only gets filmed when there’re no cars which shockingly meant only a couple of minutes of recording during hours of filming. We share the same irritations and fascinations and might work together in the future.

Building & talking

It was four weeks since the last workshop. Despite of the time span I didn’t have a lot of time to spend on the project but I was content with the research I’d done and was keen to show my findings to Anna Maria Cornelia. I also hoped to get at least one gas sensor working.
CO_sensorAs I had to wait before I could talk to her I started with Paul to work on the sensors. But first I had to reduce the voltage level for the NO2 and CO sensors to work. It took me an hour and a half to put it together (with help from Paul and Meg), hmm, electronics isn’t really my thing I fear. I find it very hard to translate a scheme (even a simple one) into a circuit. But it’s very nice to have help close at hand, maybe I’ll learn some day…

Then it was time for me to talk to Anna Maria. I showed her the experiments and she was very exited about them and said they offered me a good springboard to continue. She said the parameters: colour, length, applied pressure and pressure duration are very usable for visualization.
The research will follow tree lines. Working with a roll of paper and ink plotted in lines and stains. A humidity meter which they have in museums is a good starting point. I also want to look into punching creating a relief, much like Braille. I could work on paper but also materials like latex rubber that can have a changing relief. This way you can feel the pollution, which is also nice at night. A matrix printer springs to mind to achieve this effect. The nice thing of working with paper is that you have a tangible result at the end of the day. Like an air quality receipt. Still I also want to send life data to internet and I’ll have to think about relation between these two.
Anna Maria suggested that I might use a screen to visualize digitally created flocks and maybe incorporate a watch so you only have to wear on thing around your wrist. She also suggested that it might be nice to somehow keep the functionality I’d used in the experiments working with smell to determine air quality. I could send a marker when I notice something about the air quality so I can later see them side by side to see if my intuitions were right.
She wants me to make five (!) different prototypes by September that translate the manual experiments into something mechanical and digital.
Back with Paul I managed to get the CO sensor working. That is, it outputs a voltage which varies when I breath or blow on it. The NO2 works exactly the same so it shouldn’t be to difficult to build. Now I have to find out what a certain voltage level means. But I will have to make a start in sending the data to a server. The next two months will be very busy…

Design experiments

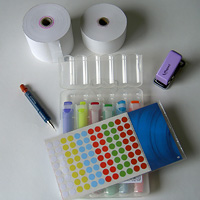
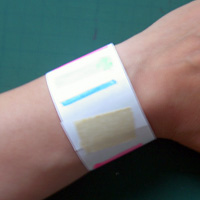
materialsAfter the last workshop I went straight to the shop and bought some ‘equipment’ to experiment with. I especially like the tiny single punch and propelling pencil. I wanted to try different ways of working with paper in a portable way. Here’s a description of the things I tried. I guessed the air quality from smell.


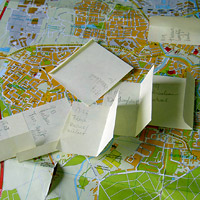
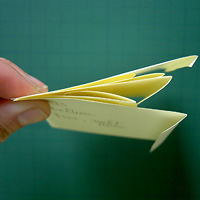
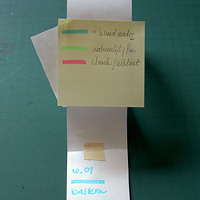
  • Folding I used standard Post-it notes, wrote the location, date and time on them and folded them. The bigger the fold the stronger the pollution. This gave you little space to write if there was heavy pollution. But I could stick them on a map and get a nice 3d landscape of air quality indications. At the end of the day you can see the course when you stick the notes together as a little book.
  • foldingfolding1
  • Writing
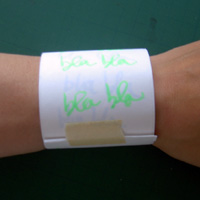
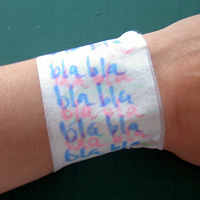
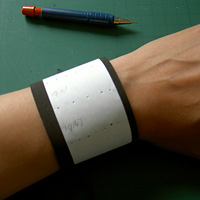
    I bought two different sizes of paper rolls. I wound them around my wrist and tried writing dummy text on them with different colours of felt-tip. The colours indicating air quality. I was surprised how much space I had to write. I had to make sure the paper wasn’t too tight around my wrist so I could twist it. Folding back the paper gave me even more space but this didn’t work very well when you were outside, the long streamer blew away in the wind. Seeing the older values shine through added an interesting dimension. It was a bit of a nuisance that I had to keep a separate legend.
  • writing
  • Coding
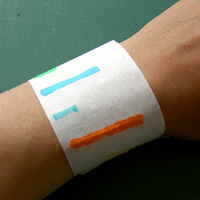
    I also tried coding the air quality using lines. Longer and thicker lines means stronger pollution, thinner and shorter less pollution.
  • codingcoding1
  • Medial tape
    The use of medial tape gave a more stable surface to write on. You could feel the chill from the felt-tip when writing which can also act as data, warning me of strong pollution. It is hard to write on the inside of your wrist though. The shine through effect is even stronger here.
  • tape
  • Rice paper
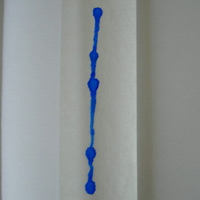
    I also experimented with ink on rice paper. Because the ink seeps through on the layer below you can only use one piece of paper at a time. Feeling the ink spread on your skin and watching it on the paper is very exciting and expressive. The results are very artistic. I tried to vary the duration and pressure to express air quality. I’ve worked with lines and stains. Using felt-tip I could and the colour and line length parameters. I ended up with a long line combined with stains where I didn’t move the pen. That’s my favorite because it also has a time element.
  • ricerice1rice2
  • Punching
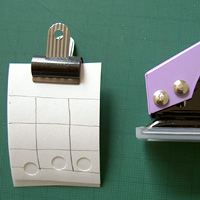
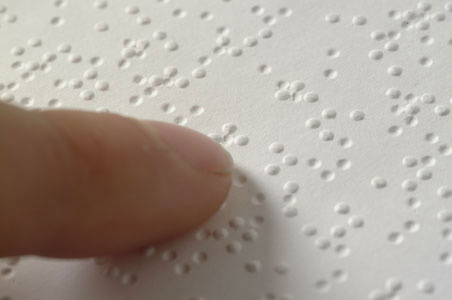
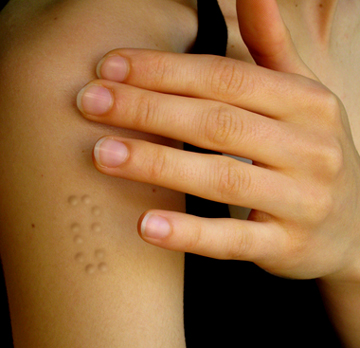
    I used a propeller-pencil for writing and punching holes. I was nice that I only needed one tool to do both. I was a rather painful process so I found a rubber layer to protect my skin. That felt very nice and made the punching much easier. The distance between the holes indicated the pollution, more holes in one line means more pollution. When you turn the paper you get a relief like Braille, this is also an expressive way to work with the data.
    Finally I used the mono punch to punch holes in pieces of paper. This was a bit of a disappointment because you couldn’t really aim where the hole would be. The idea was to make the horizontal punches bad air quality and vertical good. The more, the stronger.
  • punchpunch1

First sensor

Hmm, this afternoon at the lab was a bit frustrating. As a starter a lot went wrong with the purchase of the two AppliedSensor sensors and the temperature sensors. My order went wrong, twice. It was a national holiday on Thursday so I feared that the stuff wouldn’t be in by Saturday. But finally, at 19.30 on Friday the box arrived. I now have a cute collection of rabbit droppings 🙂

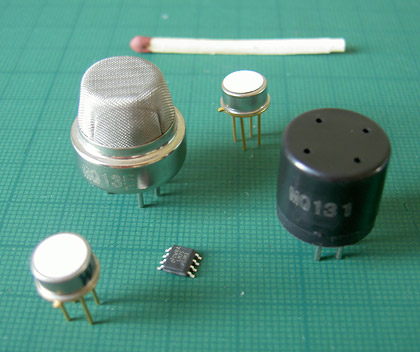
Collection of sensors I ordered

From left to right: multi gas sensor, CO, O3, lower row: NO2, temperature.
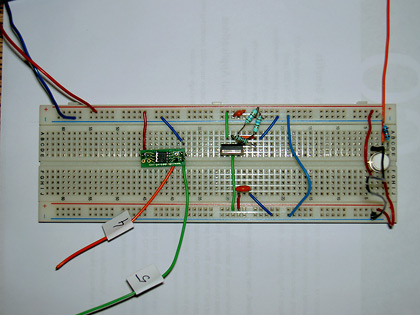
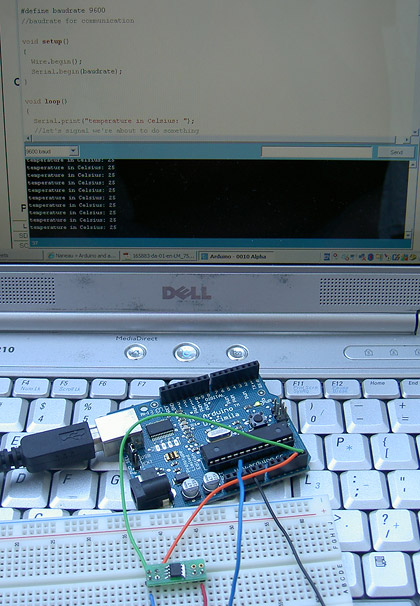
But they aren’t that cute to work with. They worked at a different voltage than the Arduino(NO2, CO – 2.3V and O3 – 6V). So I needed different parts which weren’t available. The voltage creates the right temperature for the sensors to work and that’s critical. So the only sensor left to work with was the LM75 temperature sensor which works with the I2C® interface. This is supposed to be very easy to work with but for me as a lay person it’s still complicated. Paul found a tutorial on the web for connecting it to the Arduino. Everything works fine except that the temperature is always zero degrees. I think it’s just some minor thing we overlooked because it was already late in the afternoon. But it’s a shame that I can’t bring a working sensor back home.

Update Sunday 19:16. Yes, I got it working! I think I made two mistakes in the wiring. One very basic one, I forgot to attach the sensor to the 5V *blush* and I mixed up the two wires coming from the sensor. I reread the tutorial: ‘Using the Wire library, the Analog Input 5 is automatically set up as the SCL line’ and I now put the data wire SDA, in 4 which works fine. The temperature does seem to be two degrees too high…

Temperature sensor in action

Collaboration…

During the I-machine festival in Oldenburg, Germany I met Laura Beloff, who has lots of experience in working with wearables. As it happens she is heading a research and art project on climate change, in Lapland, Finland. At a later stage they’ll also be developing wearables for measuring pollution. She’s interested in collaborating with me. I’ll be keeping her up to date of my progress and findings and she’ll see if she can provide help if needed later on. She’ll also be informing me of requirements they will be formulating together with the scientists. I can see if I can integrate them in my wearable.

With the wearable they also want to promote Citizen Science which is letting the general public collect data for scientific purposes using for example their mobile phones. So I suppose I could fit in there nicely. She already had some tips for me. I should use a Symbian phone with integrated GPS. For her projects she used a Python script to communicate with a server. She said that Processing wasn’t very good yet in the mobile department. So I have good reason to speed up my purchase of a new phone/PDA 🙂

Interface research

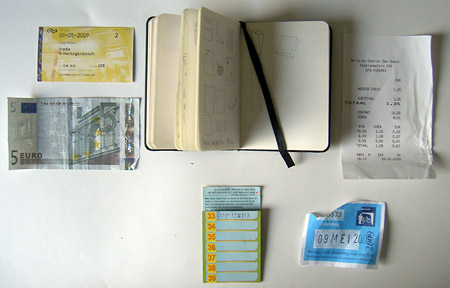
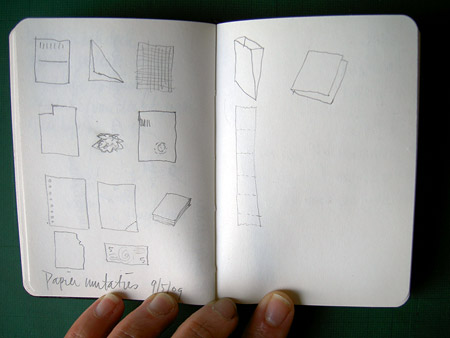
As soon as I left the last meeting I started sketching and thinking about ways to work with paper. I will use my findings in the experiments I’ll be doing about low-tech air pollution logging.

I just empties my pockets: there are so many ways to use paper!
I just emptied my pockets: there are so many ways to use paper!
Just some ways to use paper for different type of notations
Some ways to use paper for different type of notations

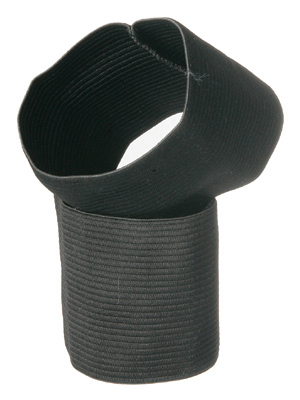
I also did some research about the wearable interface. As I want an intimate tool, close to the body I found these associations on the web.

mourning-band
mourning-band
goose-flesh
goose-flesh
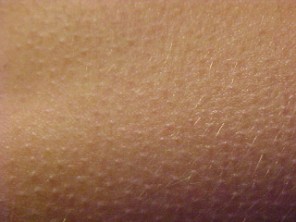
Feel data
Feel data
Talking about unobtrusive and intimate :)
Talking about unobtrusive and intimate 🙂
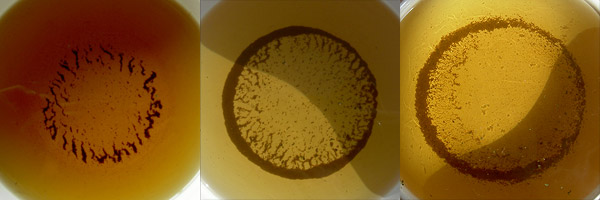
Tiny flocks in my teacup

Measuring gasses

I’ll have to make a choice of what gasses I want to measure. The government measures the following gasses at different locations in the Netherlands: 

  • SO2 Sulfur dioxide
  • PM10 Particulate matter (PM) or fine particles
  • NH3 Ammonia
  • CO Carbon monoxide
  • O3 Ozone
  • NO
  • NO2 Nitrogen Dioxide

My choice will depend on the availability of the sensors, ease of work in connection with the Arduino.

I’ve found where they sell the AppliedSensor NO2 and CO sensors. Not too expensive, around 30 euro’s  each: http://www.conrad.nl/goto.php?artikel=502242, I’ve ordered them already.

I’m also going to use a temperature sensor, the National Semiconductors PROG.TEMP.SENS.MET I2C INTERFA. It’s nice data to have and it might be necessary for the correct interpretation of the pollution sensors.

I’ll also integrate this ozone sensor: Futurlec MQ-131 and just for fun I ordered their Air Quality Control sensor: MQ-135 for only $6,90 🙂

I’m still in doubt about including an oxygen sensor. I’ve found two (view links) but I think they’re for use in cars. The tree sensors I’ve chosen now give a good indication of air quality. I could change my way of thinking; If the pollution is low the amount of oxygen will be high…

Concept research

Data visualisation

I’ve been rethinking what visualisation is. My aim is to give an impression of air quality in a friendly way. Living things tell about their state in obvious ways. When you blush it tells me something about how you feel. When a tree is big and green it tells me it’s healthy. By the shape of a flower I can tell if it’s blooming or dying. A knot in a handkerchief tells me not to forget something.

zakdoek_knoop

I’ve been interested in flocksand random shapes for a long time. They also say something, display a state but in an even more mysterious way. But they speak for themselves, very organically.


 flock

I want my wearable to be intimate and close to the body. Simple and plain like a wrist watch or a quick reminder written on my hand. Or a scribble in a notebook. The most simple and direct way for us to visualise data, any data, pencil and paper.

Materials

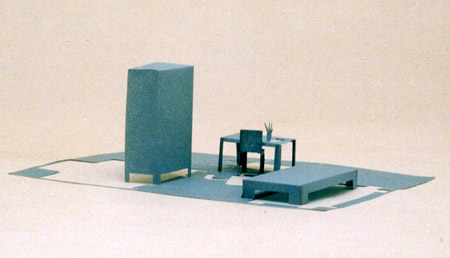
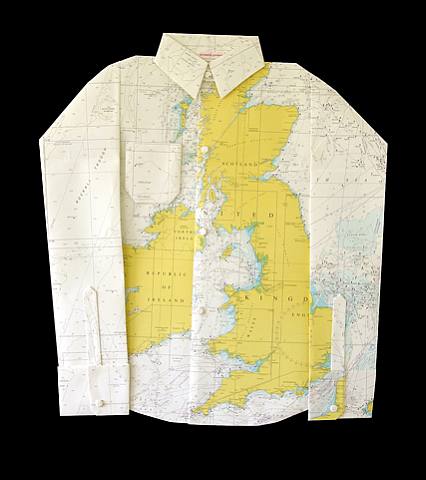
We also had to think about the materials we want to use. When I think about visualising data, the first thing that springs to mind is pencil and paper. Make a garment you can actually log on…
artwork_images_162052_282914_elisabeth-lecourt1

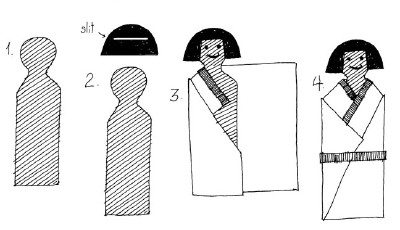
paper dolls

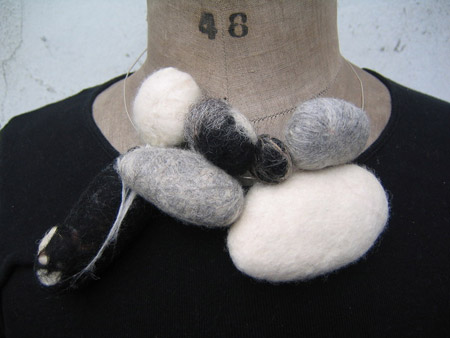
As I was also thinking about making a nature like shape which can change, felt is a nice choice.
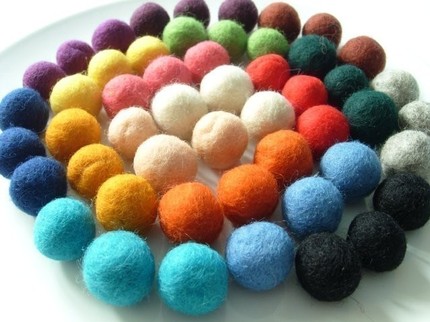
 felt_stones

felt_balls

I thought it would be nice not just to measure pollution but give something back… oxygen 🙂 It can go something like this
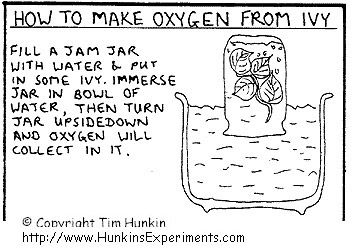
make_oxygen

Or this:

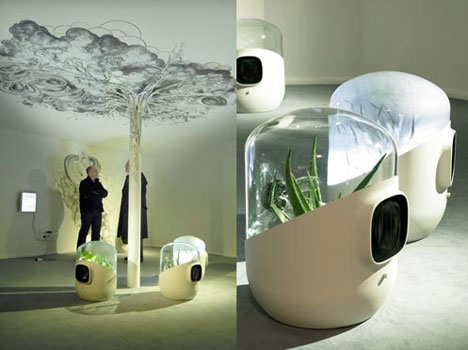
Bel-air by Mathieu Lehanneur

A great design by Mathieu Lehanneur.
The pleasures of designing

Yesterday I went to the second meeting. It got me so excited I even dreamt about it.

As we all had to rethink and deepen our ideas about the concept we did a round of our current status. There were a lot of suggestions for everybody from everybody, so that was a nice exchange. We’ll have nine completely different pieces at the end of this project.

After the general round we had the opportunity to ask specific questions about the concept development (Anna Maria) and technique (Paul.) I think it’s a blessing that there are people like Anna Maria. I explained my new line of thinking and the research I’d been doing on the net. She was quite excited that I got away from the LEDs. I was very excited that we found ways for me to experiment with an old love of mine, paper.

Cutting from air mail paper

I’ll start working on low-tech tests for logging air quality on paper, exploring the different possibilities of the material. I’ll also be recording what the different experiments feel like for me (I consider that to be a kind of meta-design-notes, very interesting.) I’ll also let other people log their air quality experiences and record their experiences on doing so as well. We’re both looking forward to the results and I can hardly wait to get started.

With Paul I discussed the sensor pitfalls. The sensor options we looked at all work in a similar way, they change resistance. And they all need calibrating… So I’ll probably have to rent equipment for that because I do want to make my data to make sense.