Hardware integration

Buttons, temperature and humidity sensor

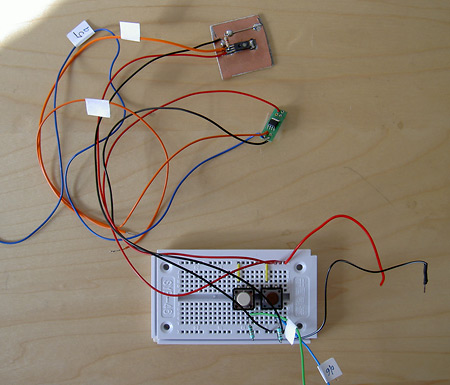
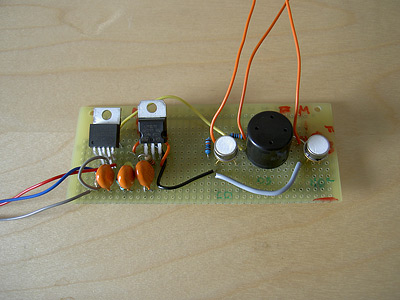
On the photograph you  can see the 5 volt circuit. It houses two sensors and two buttons. At the workshop last Saturday I put together button circuit, if you press the white one it means it smells good, the brown one indicates it smells bad. This is of course just a functional setup, purely for testing hardware and code. Later I’ll make soft buttons which will be integrated in the vest. We also made the humidity sensor (the kinky copper plate, we ran out of circuit board.)  It will take some time to calculate the actual humidity from the output and before I can use it with the ozone sensor. A period of extensive callibration is due anyway.
I worked on the code which I completed today. The Arduino now collects data from all sensors (except the gas sensors which somehow have stopped working at the moment) and outputs an ‘e’ when no buttons was pressed, a ‘+’ when the smells good button was pressed and a ‘-’ when the bad button was pressed. It works in a two minute loop which is broken when a button is pressed, then data is immediately collected and send.
As for the sending part, I’m still working on the Bluetooth connection between the Arduino and the phone.
Is it Art?

Last Tuesday evening we had a meeting about our concept and design with AnnaMariaCornelia. While we ate our pizzas and drank our (free) wine we discussed the current state of wearable design. AnnaMariaCornelia was very firm in her conviction that my project isn’t art. I was a little shocked at first because working on this project really makes me feel like an artist again after so many months of webdesigning… 
But maybe this project is just really me. I work on it from an artists perspective and that gives me a great sense of freedom. But at the same time the project allows me to indulge in design, data visualization, programming, developing, science, ecology, writing, data, webdesign and fabrics to name but a few issues that this piece encompasses. I suppose that in that sense I’m a very modern artist (if any) because the borders between disciplines are blurring. Projects like AQAb give room to all my interests. Subjects that already play a part in my life can be presented in piece. So working on it makes me whole and I don’t care what people call it.

Edit 19/10/09

This discussion reminds me of a remark Laura Beloff made during her presentation at the I-machine exhibition in Oldenburg, Germany. She’s researching conceptual wearables. She said there weren’t many around. Most wearables are either functional or fashionable but hardly any of them work from a concept. She’s done a nice job with her project Empty space.

High visibility coat for dogs

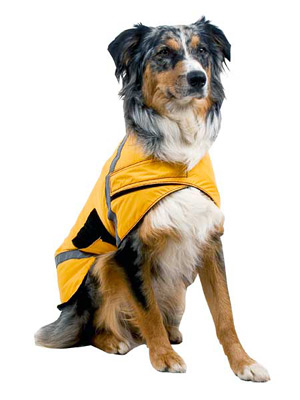
When we discussed my design, and I don’t remember how it came about, we started talking about a small vest for a child for example. Being a great dog lover I immediately said:”To have one for a dog, that would be fun.” Well, that idea has stuck and now I think I’ll make a cute little vest for a dog to wear. As it happens I bought another sensor which is a general gas sensor. Closer akin to a dogs nose, probably. So the dog will wear that sensor, close to the ground. It will be interesting to see what the differences are. I want the sensor to work only when the dog lifts it head (to smell) so I’ll use an accelerometer to see if the head is tilted. The visuals on it’s vest will show the boss the air quality at dog nose height.

Screen printing

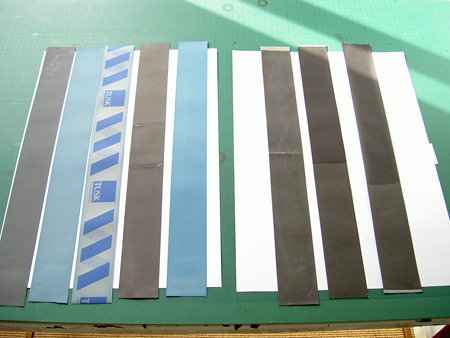
Matsui on the left, Thermostar on the right

This Monday I worked with Peter, a screen printing expert on my reflective strips. We tested two different inks: the Matsui and the ChromaZone.
I bought the Matsui ink in a very nice turquoise blue to be activated at 27 degrees and a black with an activation temperature of 25 degrees.
The Dutch firm Blanken Controls was very kind and send me a sample set of pigments and binders of the ChromaZone ink. I used the black which activates at 31, it came with two different binders which we tried both.
We started with the Matsui. I tried mixing the blue with black but it didn’t give me the rich dark blue I was hoping for. We soon discovered that the ink wasn’t at all opaque. Adding more pigment and printing several layers helped a little but I want a smooth, opaque plane. But neither the blue nor the black was satisfying.
How different it was with the ChromaZone! The first attempt yielded an almost perfect opaque result. There wasn’t any difference between the textile and screen binder as far as I can tell. Applying two layers creates a deep black but when heating with the conductive fabric is does lose a lot of the reflective qualities so I’ll have to settle for one layer, which is enough. After taking a strip with me it does appear to be brittle when it folds.
Yesterday I’ve been hunting for UV protection varnish. It’s had to find for this material and use but I’ll find something. To be continued.

Things look bright

Todays harvest from the post

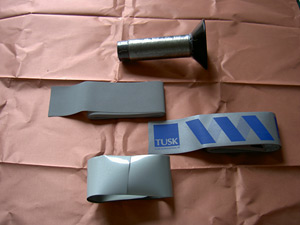
A lot of material happened to arrive by post today. Very fast were the retroreflective strips samples send to me by Tusk international. Test I’d done earlier on this type of material was disappointing. But the tests with thermochromic ink on the stripes looked really good. I’m very pleased with the heating of the conductive fabric. It has ultra low resistance (0.05 Ohm) and therefore needs less power. My old friend and screen printing specialist Peter can hopefully help me get more opacity and smoothness with the ink. I hope to do some tests next week. Things to look into: using more pigment, binding, UV radiation. I’ll try and make an appointment with Zijdelings next week. They sell the thermo pigments and also silk metallic organza in different colours.

Heating the reflective strip

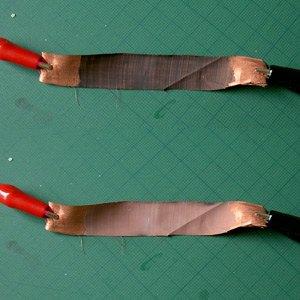
fabricI had a brainwave and realized that I could also use silver conductive fabric for the strips if things don’t work out with the retroreflective material. The copper fabric gives excellent results when painted with the thermochromic ink.
Eco maps

Last week I went to PICNIC, a cross-discipline platform for creative conversation and collaboration. They offered a workshop and seminar on visualizing eco data, Ecomap Lab.
The seminar was inspiring. All speakers were interested in citizen participation, which isn’t really my starting point but maybe my finish. I always start from what effects me personally and what I want to know and make. But these maybe things a lot of people want to know.
Most interesting for me were:
1) The Green Watch A watch that shows time, ozone and noise level. They wanted to involve a lot of people so they could measure many different locations. That’s why the watches needed to be low engagement. People can just wear them and don’t have to be bothered by them. The maps displays individual watches in real time and collective results. They want to aid an ‘ecosystem of initiatives.’ So that everybody who’s doing similar things can also display their collected data. The watch interface was numbers, the separate mobile phone had a graphic display of noise and ozone.
2) Pachube  a web service for sharing and reusing (sensor) data. This could be interesting for comparing data with others and having others use my data. For me it’s still not quite clear how to connect but it shouldn’t be too difficult. Third parties are developing apps which holds a promise for future uses.
3) Urban Ecomap, San Francisco a global project by Connected Urban Development showing eco data per city and neighbourhoods. They also offer ways to take action as an individual and share your efforts on Facebook. The whole website is made with Flash and has a nice integrated feel. They’re working on an Amsterdam version.
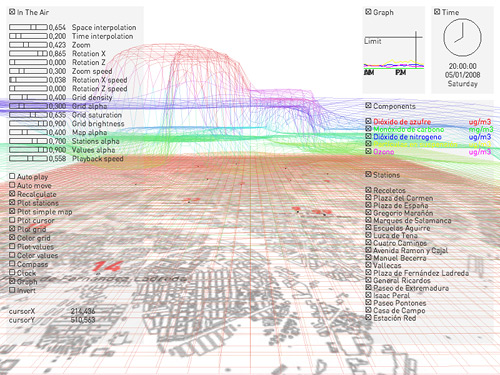
4) In the Air is a visualization project which aims to make visible the microscopic and invisible agents of Madrid´s air. I love this project. It has a smart looking, animated 3D visualisation of different gasses and particles (Sulfur dioxide / Carbon monoxide / Nitrogen dioxide / Particulate / Ozone.) Apart from the website they have also experimented with a physical prototype using water vapour. I especially liked the domestic versions that people can place on their balcony or window, and the kids version with coloured balloons.

Screen dump of In the air visualisation tool
Screen dump of In the air visualization tool

In the afternoon we discussed issues and possible success scenario’s. I found it inspiring to thing about ‘natural’ ways of displaying data (embedded in the environment) and low-tech ways of collecting data using your body as a sensor.

Productive

Nice vest with functionality

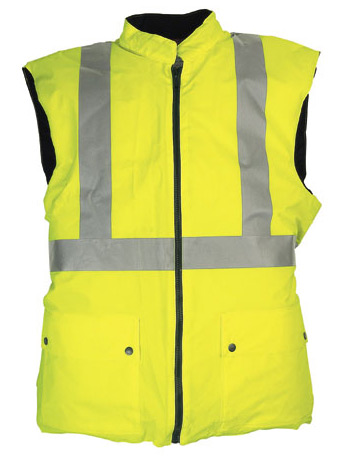
My aim for this workshop (19-9-09) was to put the three sensors together but we also had a have a meeting with AnnaMariaCornelia concerning the design. The rest was kind enough to let me meet first. I showed the various designs I did with the safety vest as basis. The vest was present from the start of this project because of it’s connection with safety and the clean way it signals a simple message. So Anna suggested I stick to those basics instead of just decorating the vest. She’s absolutely right of course. I should just use the esthetics and functionally of the vest to inform about air quality. Research has shown that the amount and broadness of the reflective stripes indicate higher safety. So I can vary the width of the strips to indicate more or less pollution, resulting in more or less visibility. I’ll use strips of conductive fabric to heat the paint. That should give a nice, clean result.
My research also showed that there are some very functional coats with different pockets. I want to use them in my design to store and build in the boards, buttons, phone and power supply.

The building of the board with sensors went pretty smoothly. That’s no surprise with an expert like Paul standing by my side. So now I’ve got a great little board with all the sensors powered at their own voltage. We also build in a switch to turn all the sensors on and off at the same time to increase their lifetime. We did discover that the ozone sensor is influenced by humidity. So I ordered a humidity sensor yesterday so I can at least measure it. How to interpret the data is a completely different question, the next problem to tackle.

Three sensors integrated into one board

A technical meeting

There was a small group at the meeting last week. Which was nice in the sense that we could all claim Paul (the engineer) for a longer time. Today we all inventoried our current status and needs with regard to the technical part of our projects.

Thermochromic ink

Testing with conductive yarn and thermochromic ink

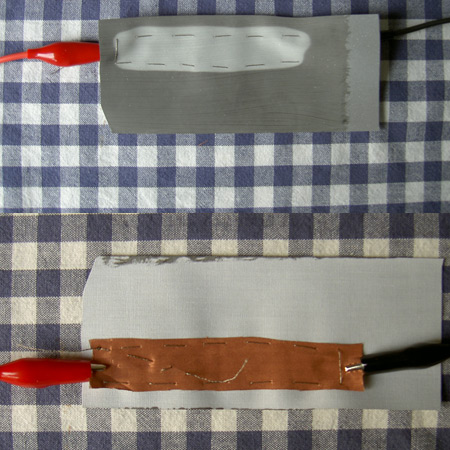
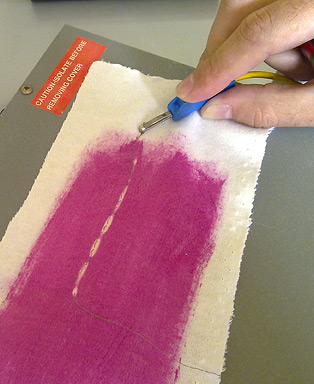
First I did tests with the thermochromic ink and conductive yarn: to change colour the voltage should be between 6 and 12 and 0,1 ampere. With 6 volt you can change ink above a straight line of yarn for about 6 cm. For longer stretches stitching of the same length can be placed parallel. When the yarn is stitched tightly it is easier to change the colour. Thickness of yarn will make a difference. I’ll have to do some tests. I can use an adaptor to try out different voltages to work with, the ampere value can stay the same.
Arduino
I worked a little on the Arduino program which will be pretty straight forward. I will have to make sure that the sensors have time to heat up before I read the data. It is unclear how many minutes the sensors may stay on. They may deteriorate quickly when they stay turned on too long.
Sensors
Paul is going to work on the schematic for the three analogue sensors. It’s pretty complicated because they use different voltages. We’ll be using a part that will allow us to completely switch them off. It will give us more control and save power. He’ll also calculate the power needed. Most power will go to heating the yarn or wire for changing the colour pattern. Depending on the length of the wires we’ll need more or less power.
Solar power
It is possible to realize the wearable using solar power. The panels will be used to charge batteries and not to power the wearable real-time. Solar power is too instable because I’ll be needing enough power every two minutes to measure and change the display. But it will run independently on it’s own solar panels which makes me very happy. I’ll probably need 6 C batteries to power the wearable which will make it heavy…
Communication
I’ll probably use Bluetooth to communication for talking from the Arduino to the phone. As I can’t find any documentation on serial/USB communication.

No-tech prototypes

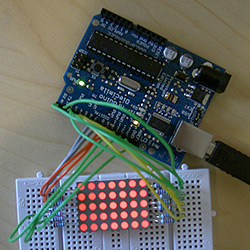
Fruitless attempt at working a LED matrix

After trying some work with a LED matrix I decided that is was time to look for a simple way to experiment with the visualisation of the data.

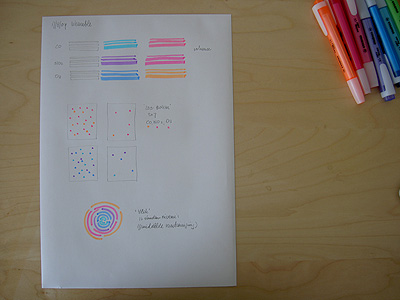
Sketches
Sketches

There are three routes to take: the stain, the line or the flock route. I’m looking for ways of translating the parameters: colour, length, applied pressure and pressure duration which I’ve used in the paper models. I made a sketch using the same felt-tips as I used for my earlier prototypes.

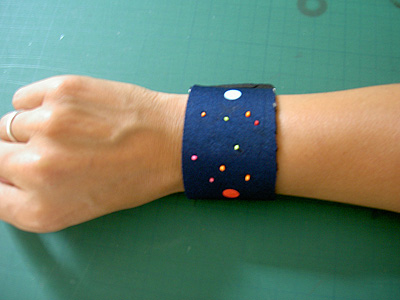
I made a flock wrist-top with fake LED’s. Two paper ‘buttons’ can be activated to indicate nice or bad smell.

Fake LED flock on wrist

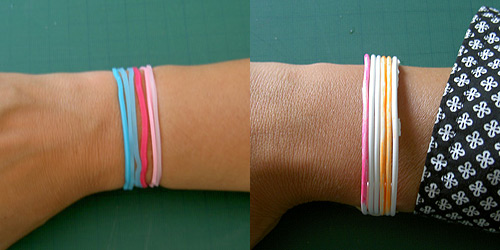
I tried the lines with coloured elastic bands. That worked very nice. But translating that to fake EL-wire it was just too stiff.

Experiments using coloured lines

Then I read a nice article by Joanna Berzowska from XS Labs in this .x-med-a. publication. That was very inspiring in terms of how to approach a wearable and in term of the visualisation. She talks about ‘non-emissive, multi-pixel, fully addressable textile displays’ which are constructed entirely with soft materials like conductive fabric and yarn and thermochromic inks. Besides being completely integrated into the wearable they also have a nice refresh rate (rather slow e.g. 10 seconds to appear and disappear) that matches the speed of the sensors.
I’ve found this video: Electric Plaid: color-change electronic textile from XS Labs that demos the technique. You heat up the yarn with electricity and that heat activates the thermochromic ink. Using a layer of paint underneath the thermo ink you can create different colours.

This video also gives good insight into the process.  And a nice article: http://wearables-chootka.blogspot.com/ and another one: http://clemenswinkler.com/skin/?cat=1 where this technique is used.

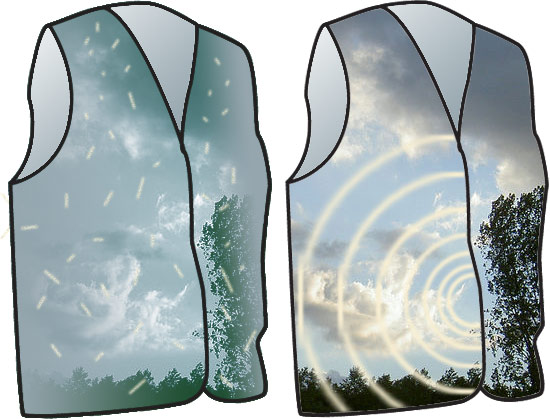
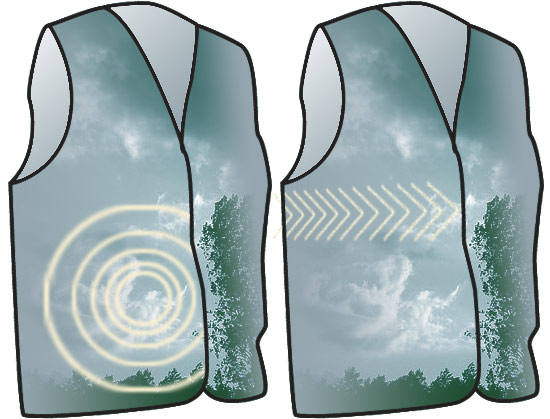
Here are some designs I made for this technique.

Two types of visualizations


Two other types of visualizations

I’ve tried with copper wire and a piece of fabric with heat sensitive paint that was lying around but I can’t generate any colour changes with it yet.

I heart Python

I’m continuing my quest for my mobile app. It’s at the heart of sharing the data I capture with my sensors. After I’ve started the program it should:
Connect to the Arduino board very n minutes (2 for example)
 Arduino should start the sensors
 wait for a few seconds (they need heating up)
 loop through pins a, b, c, d (NO2, CO, O3, temperature)
 check smell flag
 turn of the sensors
Loop through the Arduino values
Store them as a Python dictionary
Get the latitude and longitude from the internal GPS
Store them in the same dictionary
Connect to the internet
Post the dictionary content to a PHP script (which writes them into a database)

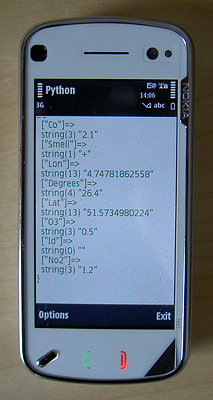
Data returned after inserted into database

I’m relieved that I’ve made some progress. Yesterday I made a connection to internet and posted variables to a (very basic) PHP script. Today figured out the elegant data type called dictionary. http://docs.python.org/tutorial/datastructures.html#dictionaries It’s a kind of array but you can store key:value pairs. So they’re ideal for creating POST variables to send to a PHP script and very easy and flexible to build. I build a little air quality table that stores all the sensor data, date and time and whether or not the smell was nice at the time of the measurement (more about that some other time). Once I’d manage to store all the values in the database it was time to look for code to read out the GPS values. I came across this great tutorial with a tiny bit of code. http://www.scribd.com/doc/8981028/Tutorial-PythonForS60 Enough for what I need.
Of course the code will have to include error handling. The next step is connecting to the Arduino.

Update 9-9-2009
After working with the program for a bit it’s clear that it sometimes takes quite some time for the GPS values to be found. Earlier I had a field in my database table which would insert the data and time at the moment the data was posted. This may very well not be the time the air quality is measured so now I use the phone time which I can also read and format easily with two lines of Python code. Love that language!

Python kick-off

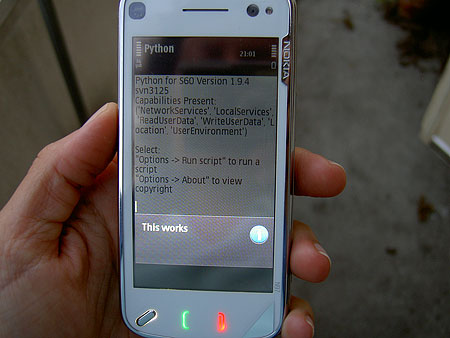
Last week I did some research on Python for mobile devices. I was so enthusiastic about the documentation I found online and the apparent ease of the language that it was also clear to me what Smartphone I would buy. After quite some hesitation I decided to go for the Symbian based Nokia N97. It beat the i-Phone because I’m already used to Nokia, it has a real keyboard, a 5 mega pixel camera and it runs on Symbian. I found this great tutorial by one of the authors of ‘Mobile Python: Rapid prototyping of applications on the mobile platform.’ I haven’t bought it yet. I’ll see how far I can get without it as there is lots of info to be found online. They do have a chapter on interfacing with an Arduino board which isn’t in the code section. To get started you only need a simple text editor and the latest stable Python for S60 (Pys60) programs which you must upload to your phone. At this moment they are the Python_1.9.4.sis and PythonScriptShell_1.9.4_5thEd.sis as my phone runs on the latest, 5th edition of Symbian. They are not at the top of the maemo list so it took me a while to find out which versions I had to download. I installed them with my Nokia software. All I had to do was to write a little script:

import appuifw
appuifw.note(u"This works", "info")

For example and store it as a .py file. Upload it to my phone. Then go to the Pys60 program on my phone, run the script and see the following astonishing result 😉


It works!
It works!

Even though the result is of course very simple a ‘Hello World’ script is quite rewarding because you know the routine of writing and uploading and you know your software is working correctly. I’m really looking forward to programming scripts on my phone because so much is possible. From databases to turning your phone into a server!