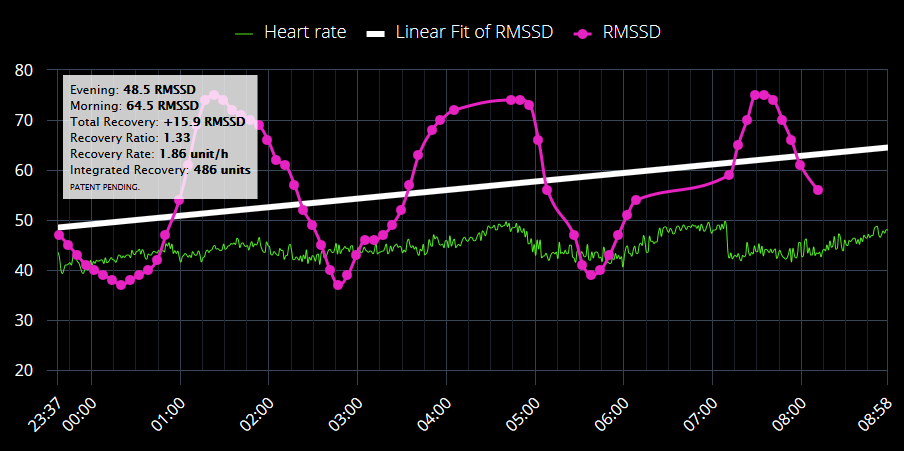
As I explained in my previous post I find the recovery measurement very useful. It seems a good representation of how rested I feel. It is calculated using RMSSD. The Emfit knowledge base explains it like this: “… For efficient recovery from training and stress, it is essential that parasympathetic nervous system is active, and our body gets sufficient rest and replenishment. With HRV RMSSD value one can monitor what his/her general baseline value is and see how heavy exercise, stress, etc. factors influence it, and see when the value gets back to baseline, indicating for example capability to take another bout of heavy exercise. RMSSD can be measured in different length time windows and in different positions, e.g. supine, sitting or standing. In our system, RMSSD is naturally measured at night in a 3-minute window during deep sleep, when both heart and respiration rates are even and slow, and number of movement artifacts is minimized…” Here is an example of how recovery is visualised in the Emfit dashboard:
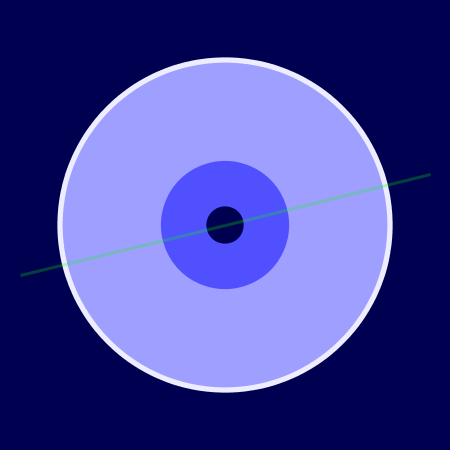
I looked for a way to integrate this measure in a way fitting with my “planet metaphor”. I’ve chosen a kind of pivot idea. It vaguely reminds of the rings around planets.
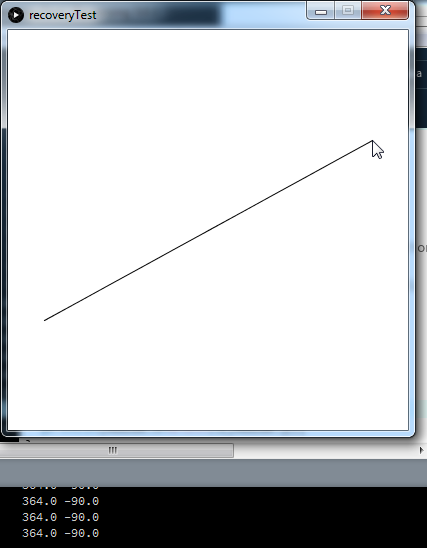
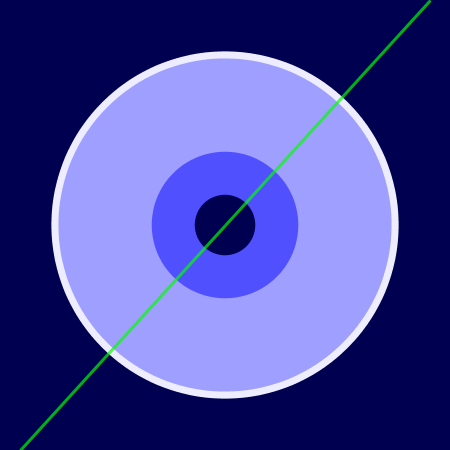
I thought it would be easy to just draw a line straight through the middle of the circles. I wanted it to tilt depending on the height of the score. It was harder then expected. I ended up using two mirroring lines and vectors. Starting point was the excellent book by Daniel Shiffman, The nature of code.
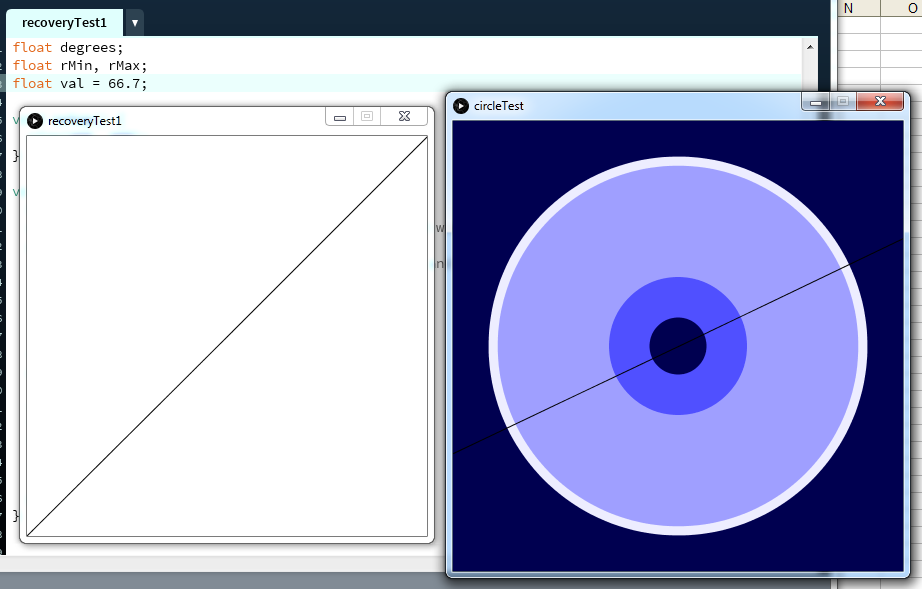
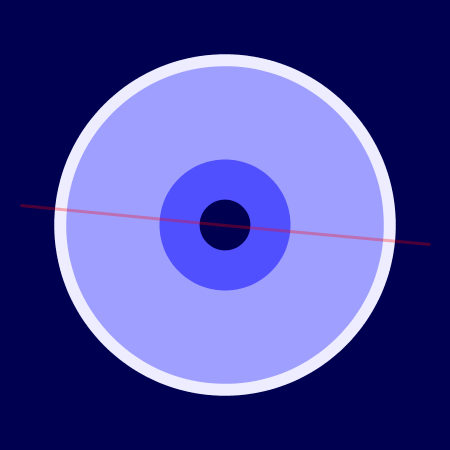
Once I got the basics working, I went on to refine the way the line should look projected over the circles. Going up from the lower left corner indicates positive recovery, visualised by the green coloured line. The more opaque the better the recovery. Of course, negative recovery goes the other way around.
The is a difference in the starting points from which the recovery is calculated. Sometimes my evening HRV is very high. This results in a meagre recovery or even a negative recovery. I might think of an elegant way to incorporate this in the visual. May be I have to work with an average value. For the moment I’m still trying to avoid numbers.