Finally, I’ve started to work on a piece that’s been on my mind for almost two years. Ever since I met the nice people from Emfit at the Quantified Self conference. They kindly gave me their sensor in return for an artwork I would make with it.

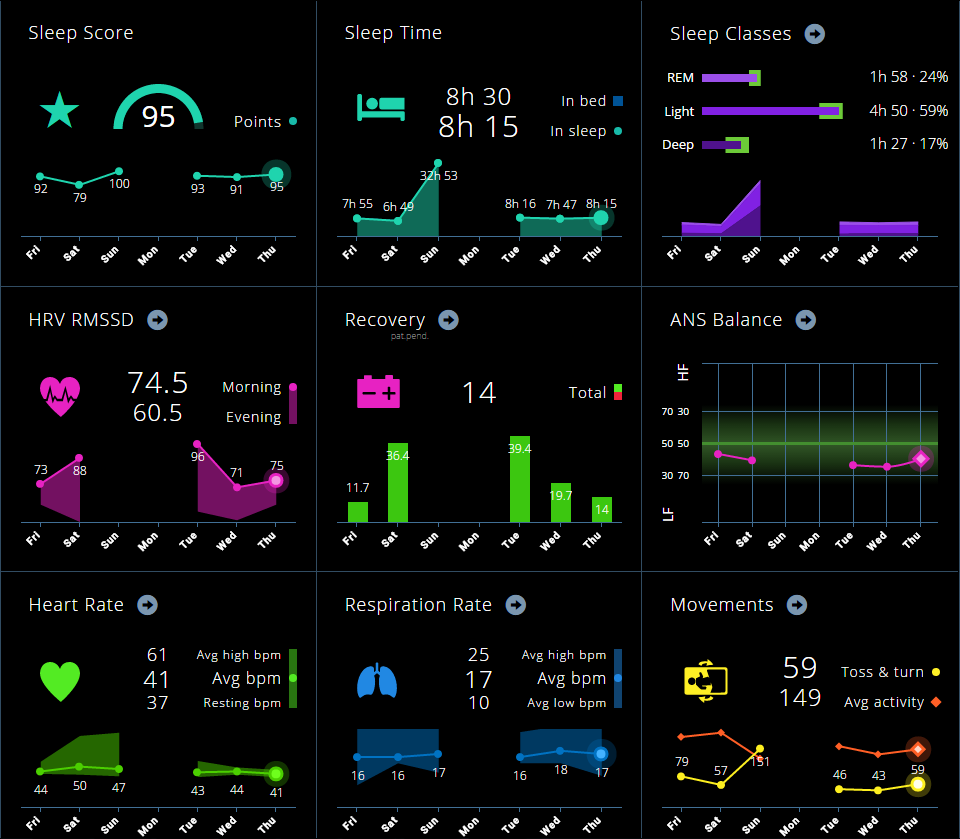
You put the sensor in your bed, go to sleep and it wirelessly sends all kinds of physiological data to their servers: movement, heart rate, breath rate. All this data together they use to calculate the different sleep stages. From the heart rate they’ve recently started calculating HRV and recovery. This latter value to me is best indicator of my sleep quality and how energetic I feel.
Emfit offers a nice interface to explore the data and view trends.
In sleepGalaxy I want to explore the relationship between sleep quality and the following variables: exercise, social and work meetings, calorie and alcohol intake, screen time and overall happiness and stress during the day. I’m under the impression that these have the most impact on my sleep, that is, the sleep phases, the ability to stay asleep and recovery.
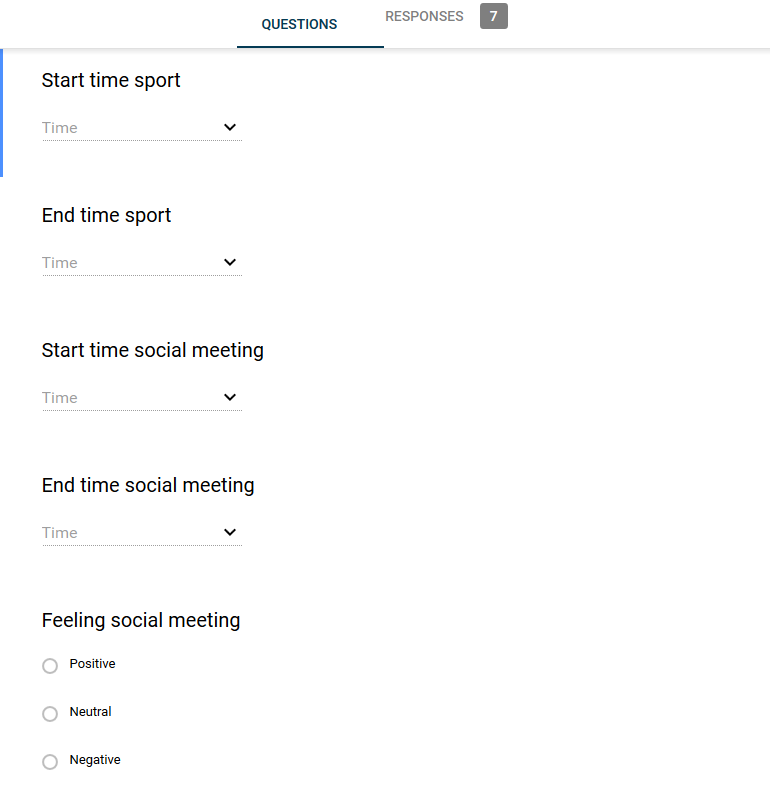
To track the variables I’ve created a Google form that I fill in every night before I go to sleep. I’ve set an alarm on my iPad so I don’t forget.
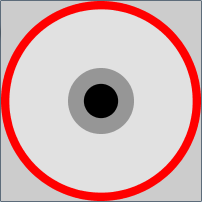
From all the Emfit data I’ll be using a subset. My first sketches focus on the sleep phases. I’ve spend a couple of hours programming first the basic idea: transforming the sleep phases into concentric circles. Going from awake to light sleep, REM sleep and deep sleep in the centre.
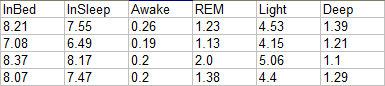
The next step was to make sure the different phases are displayed correctly, representing the amount of time spend in each phase and total time in bed. I’m programming in Processing and I’ve created an class called Night. After reading in the Emfit excel data as a csv file I loop through the rows and create a night object representing every night.
Displaying the circles went fine but the proportions between the circles just didn’t look right. I realised I had a conflict working with minutes in a decimal context. I wrote a little function that converts the minutes of the hours into decimal values and then adds them to the whole hours:
float min2dig(String time){

String[] tmp = split(time,'.');

float t = float(tmp[0])+(float(tmp[1])/60);

return t;

}
Now the basis of the visualisation is ready. The image below displays sleep phases of the four nights in the excel data from above. I look forward to adding more data. To be continued…
