Report of the meeting “Wearables and data visualisation” 13-6-13 @ V2_
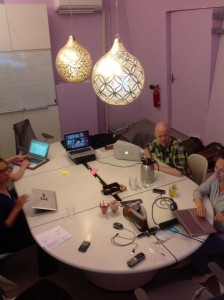
Present: Ricardo O’Nascimento and Danielle Roberts (organisers), Anja Hertenberger, Meg Grant, Beam van Waardenberg
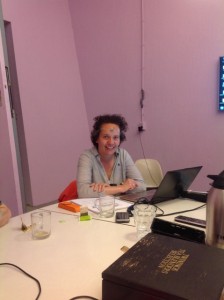
Skype: Annick Bureaud
Program:
– Introductions
– Look at and discuss examples from the web collected in a Pinterest board (http://pinterest.com/docentnv/wearable-dataviz/)
– Life demonstration
– Discussion
– Practical stuff
When preparing the meeting Danielle noticed that there are a lot of wearable viz that use knitting. We discussed why this is so. Data is logically related to patterns. Technically the Brother machines enable you to make your own patterns and connect them to an Arduino which can get input from a data stream. A drawback is that it can’t be live for most streams as the machine is too slow. We looked at the Neuro-knitting project and wondered if this is the real brainwave data? How close is the link to the actual data?
Ebru’s social knitting project where good news and bad news results in a change of colour while knitting is more a form of data logging. But it’s in real time. Other examples are: the conceptual knitting project: http://www.leafcutterdesigns.com/projects/creative-knitting-projects.html
What is data visualisation as opposed to data logging for example? Beam gave a clear explanation. Numbers are represented in a way that humans can understand. An RGB image is actually numbers transformed into colours. Our brain is the best data visualiser/interpreter. It simplifies the complex reality into something humans can grasp. So simplification is another essential. But it can easily become reduction. With reduction people lose the freedom to interpret all the layers of meaning. To get meaning from data combination of different sources and colourations between these sets is key.
Why is so many data on clothing static? To have dynamic data you need to work with electronics in clothing. As yet there is no fibre that can act as a carrier of information. Nano technology will be able to do so.
Maybe wearables are more suitable for data collection and screens more for displaying, Meg wondered? Screens are especially useful when looking back at collected data. And we all now carry our own personal screen with us in form of our Smartphone. Despite the drawbacks displaying data on you body can be significant Anja argued. Like people walking around with a sandwich board the wearer becomes part of the information. Or the funny guy at a party wearing a t-shirt with some crazy text on it. You can communicate about it. It can be seen as an extension. On the other hand part of your own identity is lost in transmitting the information.
Textile has a history as information carrier. Think about traditional embroidery to tell a story. And the use of colours and special gowns in different religions. This however has little relation to what we call data today. Data visualisation deals with Big data where data sets are combined, correlated and represented so we can derive meaning from them.
We’re still telling stories with data. This can take the form of life-logging. Ricardo’s Rambler shoe can be classified as a life-logging device. You can trace back your life from the track you’ve walked and share it on social media. Memoto is a company dedicated to life logging. Here too the device only captures images and GPS coordinates and the story is build in the database on screen.
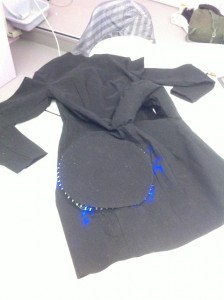
Beam showed his brand new wearable that visualises space data from the sun. This is space data we can relate to. With other space data the connection is too thin and we lose interest. This wearable is a good example of simplifying a complex phenomenon, solar flares into an appealing visualisation that is dynamic but not changing too fast.
Danielle demoed an example of a wearable as a data collector. The True-Sense kit is a tiny bio sensor that can capture posture, EMG, EOG, EEG and Electrosmog. It can capture in real-time and log data. Brainwaves during sleep and meditation, activity, heart-rate, etc. All for €35. We are all very enthusiastic about it and will be organising a hands on meeting around it to explore its possibilities.
The practical stuff concerned the quality of the remote participation. This is very poor. Melissa suggested earlier that the e-Textile group should get a better microphone (±€120). Objections to this proposal were: who will own the microphone, will it help, isn’t the connection quality the main bottleneck? Our first step towards improvement will be to try out Google Hangout. So the next meeting we’ll be using that platform.


You was wondering about how “We looked at the Neuro-knitting project and wondered if this is the real brainwave data? How close is the link to the actual data?”.
Well of course is real brainwave data, we collaborating with a scientist doing his phd in neuroscience. We using his tested algorithms for cleaning brainwave data. Brainwave data have a lot noise and if you don’t filter with good algorithm you will get more noise than real data. With the data cleaned we render the three variables (excitement, cognitive load, relaxation) each in one column.
Hi Mar,
Thank you very much for you input, nice to hear more about the background of your project. We weren’t doubting your integrity. We were discussing data visualisation and from a lay persons point of view there is just no way of telling what the waves we see really mean. This can be said about a lot of data visualisation of course so it was also a general remark.